How to Implement Charts from External Files using CanvasJS ?
Last Updated :
08 Sep, 2023
In this article, we will learn to implement bar and column charts from JSON and CSV external files using the Canvas JS plugin.
Bar charts are the pictorial representation of data in groups, either in horizontal or vertical bars where the length of the bar represents the value of the data present on the axis. They (bar graphs) are usually used to display or impart the information belonging to ‘categorical data’ i.e.; data that fit in some category.
Column charts are used for making comparisons over time or illustrating changes. In the column chart, the horizontal bar shows categories while the vertical bar shows values.
Approach:
- In the HTML design, use the <canvas> tag for showing the mixed chart graph.
- In the script part of the code, instantiate the ChartJS object by setting the type , data, and options properties of the library.
- Set other attributes or properties as needed for the styling of datasets in the graph. Write jQuery get() methods to read from the external files and use the data points in creating charts.
CDN link:
<script src="https://ajax.googleapis.com/ajax/libs/jquery/2.1.3/jquery.min.js"> </script>
<script src="https://cdnjs.cloudflare.com/ajax/libs/jquery-csv/1.0.21/jquery.csv.min.js">
<script src="https://canvasjs.com/assets/script/canvasjs.min.js"></script>
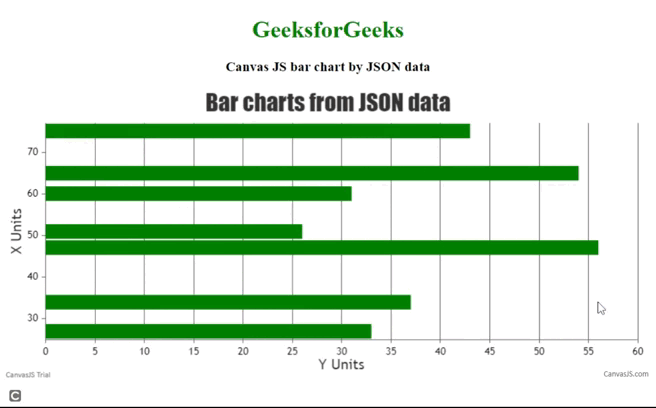
Example 1: The following code reads data from a sample JSON file and uses those data as datapoints for Canvas JS charts. The getJSON() method in jQuery fetches JSON-encoded data from the server using a GET HTTP request. The addData() method pushes all the data in an empty array to use as dataPoints for graph display.
HTML
<!DOCTYPE HTML>
<html>
<head>
<script type="text/javascript"
src=
</script>
<script type="text/javascript"
src=
</script>
</head>
<body>
<div style="text-align:center">
<h1 style="color:green">GeeksforGeeks</h1>
<h3>Canvas JS bar chart by JSON data </h3>
</div>
<div id="chartID" style="height:400px; max-width:950px;
margin:0px auto;">
</div>
<script>
window.onload = function () {
let mydataPoints = [];
let chart = new CanvasJS.Chart("chartID", {
title: {
text: "Bar charts from JSON data"
},
axisY: {
title: "Y Units",
includeZero: true
},
axisX: {
title: " X Units",
interval: 10
},
data: [
{
type: "bar",
color: "green",
dataPoints: mydataPoints
}
]// end data
});
function addData(data) {
for (let i = 0; i < data.length; i++) {
mydataPoints.push({
x: data[i].x,
y: data[i].y
});
}
chart.render();
}
$.getJSON("sample1.json", addData);
}// window onload
</script>
</body>
</html>
|
sample1.json: This file is used in the above HTML file.
[
    {
        "x": 27,
        "y": 33
    },
    {
        "x": 34,
        "y": 37

    },
    {
        "x": 47,
        "y": 56
    },
    {
        "x": 51,
        "y": 26
    },
    {
        "x": 60,
        "y": 31
    },
    {
        "x": 65,
        "y": 54
    },
    {
        "x": 75,
        "y": 43
    }
]
Output:
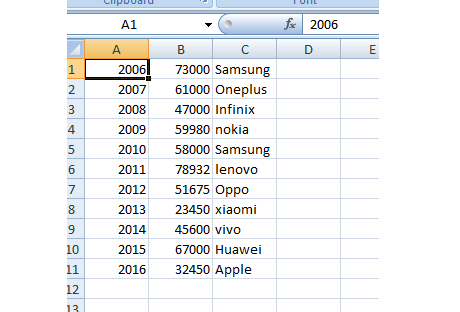
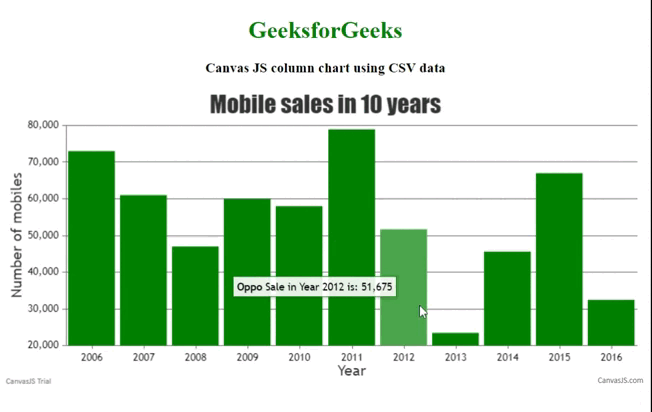
Example 2:The following code used a CSV file as an external file to display a column chart showing mobile sales over a period of 10 years. In jQuery .get() method loads data from the server by using the GET HTTP request.
HTML
<!DOCTYPE HTML>
<html>
<head>
<script type="text/javascript"
src=
</script>
<script type="text/javascript"
src=
</script>
<script src=
</script>
</head>
<body>
<div style="text-align:center">
<h1 style="color:green">
GeeksforGeeks
</h1>
<h3>Canvas JS column chart using CSV data </h3>
</div>
<div id="chartID"
style="height:400px;
max-width:950px;
margin:0px auto;">
</div>
<script>
window.onload = function () {
let mydataPoints = [];
function getDataPointsFromCSV(csvFile) {
let mydataPoints = csvData = points = [];
csvData = csvFile.split(/[\r?\n|\r|\n]+/);
for (let i = 0; i < csvData.length; i++) {
if (csvData[i].length > 0) {
points = csvData[i].split(",");
mydataPoints.push({
label: parseFloat(points[0]),
y: parseFloat(points[1]),
mobile: String(points[2])
});
}
}//end for loop
return mydataPoints;
}// end function
$.get("sampleCSVCopy.csv", function (data) {
let chart = new CanvasJS.Chart("chartID", {
title: {
text: "Mobile sales in 10 years ",
},
axisY: {
title: "Number of mobiles"
},
axisX: {
title: "Year"
},
toolTip: {
shared: true,
enabled: true,
content: "<b>{mobile}</b> Sale in Year {label} is: {y}"
},
data: [{
type: "column",
name: "Mobile phones sale",
color: "green",
axisYType: "primary",
dataPoints: getDataPointsFromCSV(data)
}]// end data
});// end chart
chart.render();
});// end get function
}// window onload
</script>
</body>
</html>
|
sampleCSVCopy.csv: This file is used in the above file.
Output:
Share your thoughts in the comments
Please Login to comment...