How to Set the Size of Canvas for Every Type of Chart ?
Last Updated :
03 Jan, 2024
In this article, we will learn various approaches to setting the size of the canvas for different chart types using Chart.js. When you work with charting libraries like Chart.js, one common requirement is to customize the size of the canvas for different types of charts.
There are multiple ways to set the canvas size in Chart.js:
Chart.js CDN Link
Include the below chart.js CDN in your HTML document.
<script src="https://cdn.jsdelivr.net/npm/chart.js"></script>
Using Inline Configuration
You can set the canvas size directly within the HTML canvas element using the width and height attributes.
Syntax:
<canvas id="myChart" width="400" height="200"></canvas>
Example: The below code uses the inine configuration to set size of canvas for every type of chart.
HTML
<!DOCTYPE html>
<html lang="en">
<head>
<meta charset="UTF-8">
<meta name="viewport"
content="width=device-width,
initial-scale=1.0">
<style>
body {
display: flex;
flex-direction: column;
align-items: center;
justify-content: center;
margin: 0;
}
/* Center the canvas */
#chartContainer {
text-align: center;
}
</style>
<script src=
</script>
<title>
Inline Configuration - Chart.js
</title>
</head>
<body>
<div id="chartContainer">
<h1>GeeksforGeeks</h1>
<canvas id="inlineChart"
width="800"
height="400">
</canvas>
<p>
Example of "Using Inline
Configuration"
</p>
</div>
<script>
// Chart Data
let data = {
labels:
['January', 'February', 'March', 'April', 'May'],
datasets: [{
label: 'Monthly Sales',
data: [12, 19, 3, 5, 2],
backgroundColor:
'rgba(75, 192, 192, 0.2)',
borderColor:
'rgba(75, 192, 192, 1)',
borderWidth: 1
}]
};
// Chart Configuration
let config = {
type: 'bar',
data: data,
options: {
responsive: false,
maintainAspectRatio: false,
}
};
// Create Chart
let ctx = document.
getElementById('inlineChart').
getContext('2d');
let inlineChart = new Chart(ctx, config);
</script>
</body>
</html>
|
Output:
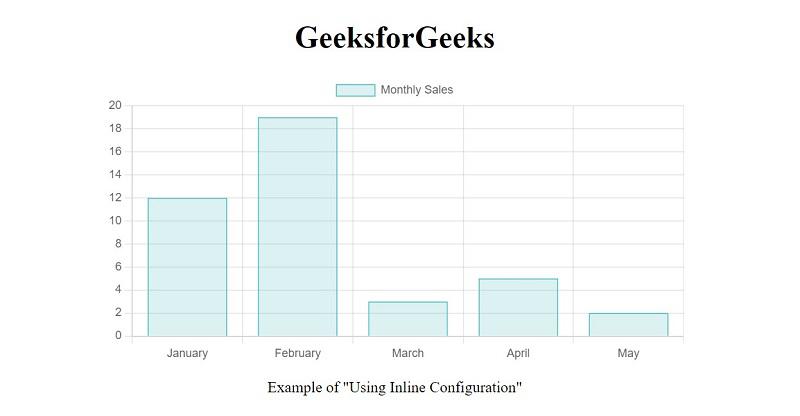
Output of Inline Configuration
Using JavaScript Options
Configure the canvas size by specifying options within the JavaScript code when initializing the chart.
Syntax:
options: {
    responsive: false,
    maintainAspectRatio: false,
    // Set your size options here
    aspectRatio: 2,
    // or
    width: 400,
    height: 200
}
Example: The below code will show how you can add the options to set the canvas size for every type of chart.
HTML
<!DOCTYPE html>
<html lang="en">
<head>
<meta charset="UTF-8">
<meta name="viewport"
content="width=device-width,
initial-scale=1.0">
<script src=
</script>
<title>
JavaScript Options - Chart.js
</title>
<style>
body {
display: flex;
flex-direction: column;
align-items: center;
justify-content: center;
margin: 0;
}
/* Center the canvas */
#chartContainer {
text-align: center;
}
</style>
</head>
<body>
<div id="chartContainer">
<h1>GeeksforGeeks</h1>
<canvas id="jsOptionsChart"
width="400"
height="200">
</canvas>
<p>
Example of "Using JavaScript Options"
</p>
</div>
<script>
// Chart Data
let data = {
labels:
['January', 'February', 'March', 'April', 'May'],
datasets: [{
label: 'Monthly Sales',
data: [8, 21, 3, 15, 2],
backgroundColor:
'rgba(75, 109, 192, 0.2)',
borderColor:
'rgba(75, 192, 192, 1)',
borderWidth: 1
}]
};
// Chart Configuration with
// JavaScript Options
let config = {
type: 'bar',
data: data,
options: {
responsive: false,
maintainAspectRatio: false,
width: 400,
height: 200
}
};
// Create Chart
let ctx = document.
getElementById('jsOptionsChart').
getContext('2d');
let jsOptionsChart = new Chart(ctx, config);
</script>
</body>
</html>
|
Output:
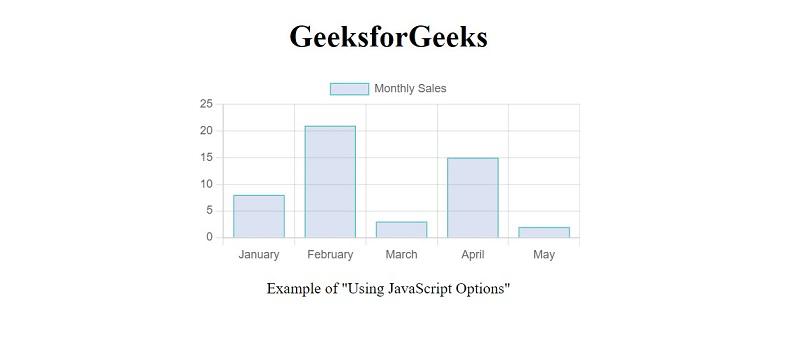
Output for Using Javascript
Using the CSS Styling
Apply styles to the canvas element using CSS to control its size.
Syntax:
canvas {
    width: 400px;
    height: 200px;
}
Example: The below example explains the use of CSS styling to set the size of the canvas.
HTML
<!DOCTYPE html>
<html lang="en">
<head>
<meta charset="UTF-8">
<meta name="viewport"
content="width=device-width,
initial-scale=1.0">
<script src=
</script>
<style>
body {
display: flex;
flex-direction: column;
align-items: center;
justify-content: center;
}
/* CSS Styling for Canvas */
#chartContainer {
text-align: center;
}
#cssStyledChart {
width: 400px;
height: 200px;
}
</style>
<title>
CSS Styling - Chart.js
</title>
</head>
<body>
<div id="chartContainer">
<h1>GeeksforGeeks</h1>
<canvas id="cssStyledChart"></canvas>
<p>
Example of "CSS Styling" for Chart.js
</p>
</div>
<script>
// Chart Data
let data = {
labels:
['January', 'February', 'March', 'April', 'May'],
datasets: [{
label: 'Monthly Sales',
data: [12, 19, 3, 5, 2],
backgroundColor:
'rgba(75, 192, 192, 0.2)',
borderColor:
'rgba(75, 192, 192, 1)',
borderWidth: 1
}]
};
// Chart Configuration
let config = {
type: 'bar',
data: data,
options: {
responsive: false,
maintainAspectRatio: false,
}
};
// Create Chart
let ctx = document.
getElementById('cssStyledChart').
getContext('2d');
let cssStyledChart = new Chart(ctx, config);
</script>
</body>
</html>
|
Output:
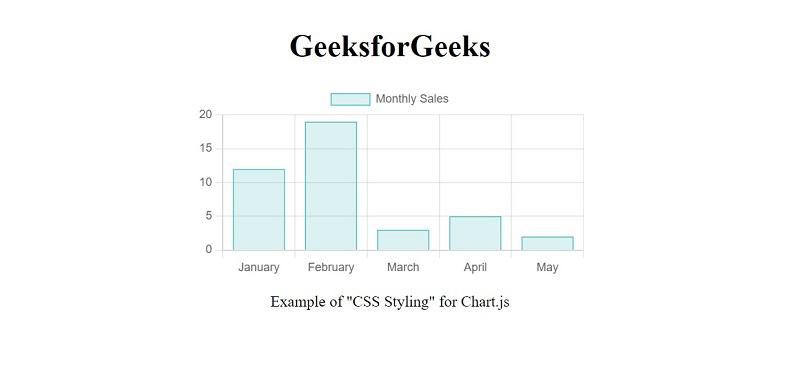
Output of using CSS styling
Share your thoughts in the comments
Please Login to comment...