Rotating and spacing axis labels in ggplot2 in R
Last Updated :
15 Nov, 2021
In this article, we will discuss how to Rotate and space axis labels in the ggplot2 in the R Programming Language.
Spacing the axis labels:
We can increase or decrease the space between the axis label and axis using the theme function. The axis.txt.x / axis.text.y parameter of theme() function is used to adjust the spacing using hjust and vjust argument of the element_text() function.
Syntax:
plot + theme( axis.text.x / axis.text.y = element_text( hjust, vjust )
where,
- hjust: determines the horizontal justification
- vjust: determines the vertical justification
Example:
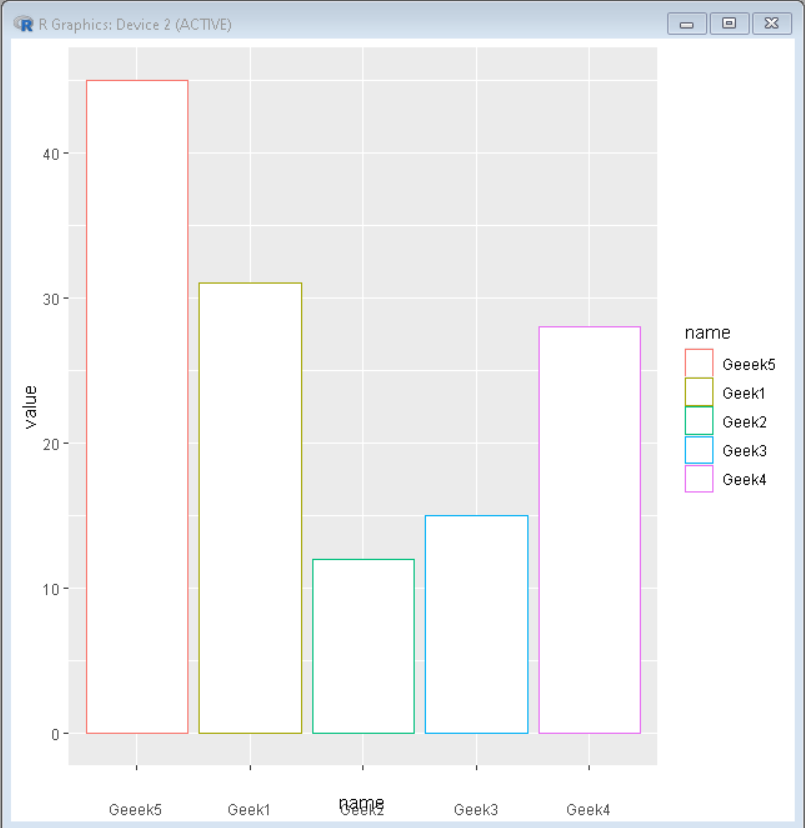
In this example, we have added vertical space of 10 points using vjust command of theme function in the ggplot2 plot in the R Language.
R
set.seed(5642)
sample_data <- data.frame(name = c("Geek1","Geek2",
"Geek3","Geek4",
"Geeek5") ,
value = c(31,12,15,28,45))
library("ggplot2")
ggplot(sample_data,
aes(name,value,, color=name)) +
geom_bar(stat = "identity", fill="white")+
theme(axis.text.x = element_text(vjust=-10))
|
Output:
Rotating Axis Labels
We can rotate the axis label and axis using the theme function. The axis.txt.x / axis.text.y parameter of theme() function is used to adjust the rotation of labels using the angle argument of the element_text() function.
Syntax:
plot + theme( axis.text.x / axis.text.y = element_text( angle )
where,
angle: determines the angle of rotation
Example:
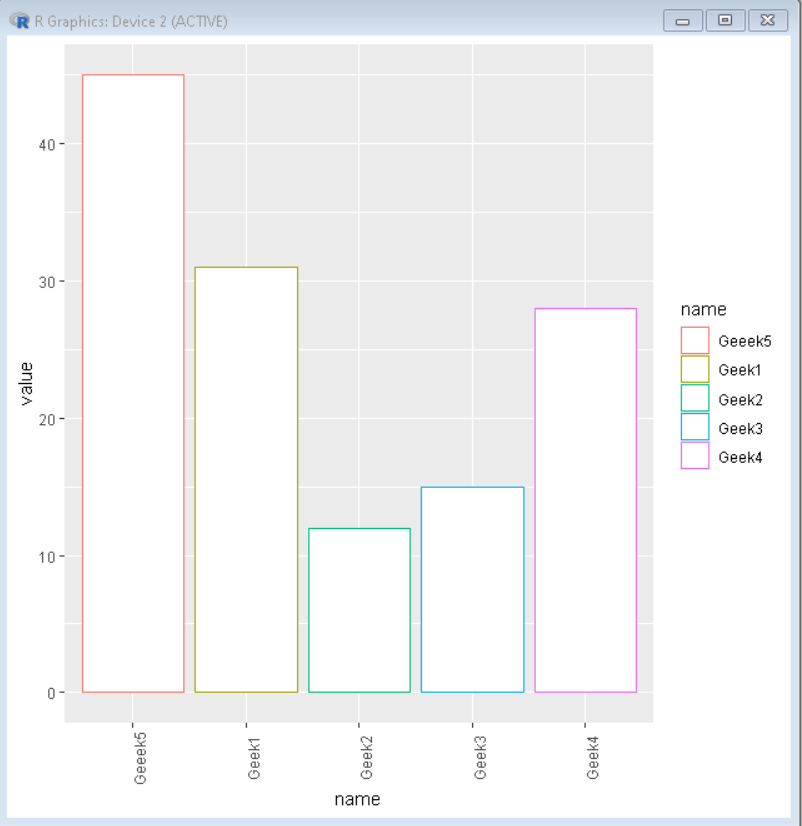
In this example, we have made the rotation angle 90 degrees using the angle command of the theme function in the ggplot2 plot in the R Language. This makes the axis labels vertical.
R
set.seed(5642)
sample_data <- data.frame(name = c("Geek1","Geek2",
"Geek3","Geek4",
"Geeek5") ,
value = c(31,12,15,28,45))
library("ggplot2")
ggplot(sample_data,
aes(name,value,, color=name)) +
geom_bar(stat = "identity", fill="white")+
theme(axis.text.x = element_text(angle = 90))
|
Output:
Example:
In this example, we have rotated the axis label by 45 degrees that made it overlapping with the plot. so we moved it down using the vjust parameter to avoid overlapping.
R
set.seed(5642)
sample_data <- data.frame(name = c("Geek1","Geek2",
"Geek3","Geek4",
"Geeek5") ,
value = c(31,12,15,28,45))
library("ggplot2")
ggplot(sample_data,
aes(name,value,, color=name)) +
geom_bar(stat = "identity", fill="white")+
theme(axis.text.x = element_text(angle = 45, vjust=0.5))
|
Output:

Like Article
Suggest improvement
Share your thoughts in the comments
Please Login to comment...