Google Sheets is the popular online spreadsheet editor from the house of Google. It provides a simple, decluttered interface and a wide range of features. Also, you can easily create charts and graphs in Google Sheets from the entered data.
Error bars are the visual representation of errors in a graph. If we are creating a chart of data, that has a specific error rate, then to represent that error in the graphs, we use Error bars. You can easily add Error bars to graphs in the Google Sheets.
This article will discuss how to add error bars in Google Sheets.

Add Error Bars in Google Sheets
It is very simple to add error bars in Google Sheets. The option to enable the error bar in Google Sheets is present in the Customise tab of the Chart editor of Google Sheets. The step-by-step procedure to add error bars in Google Sheets is given below.
Step 1: Highlight the data to be included
Open the spreadsheet to which you want to add the chart. Then, select the data to be included in the chart.
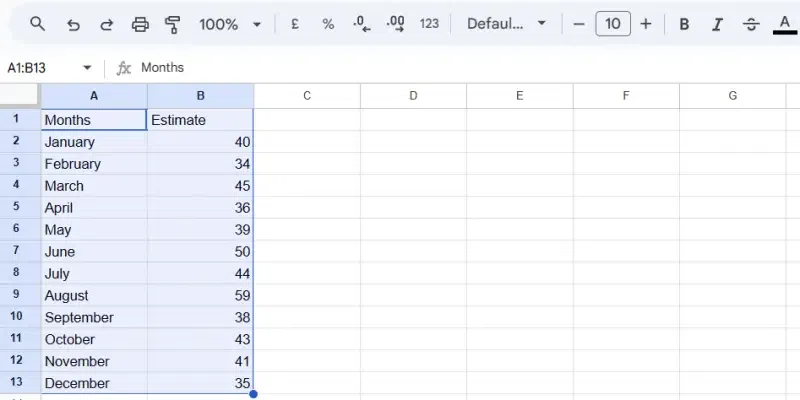
Highlight the data
Step 2: In the File Menu Select Insert followed by Chart
After selecting the data, click on the Insert from the top bar and then click on the chart from the Insert menu. It will insert a chart corresponding to the selected data.
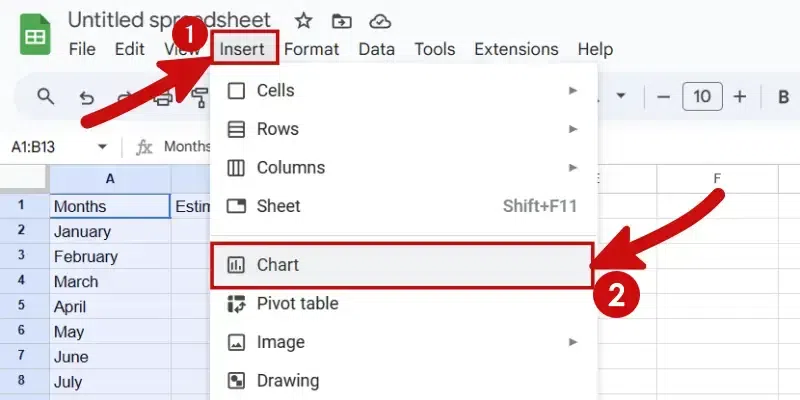
Insert chart
Step 3: Go to the Customise Tab in the Chart Editor and Click Series
Now, a chart will be inserted and on the right side, you can see Chart Editor. From the chart editor, open the Customise tab and click on series to expand the series menu.
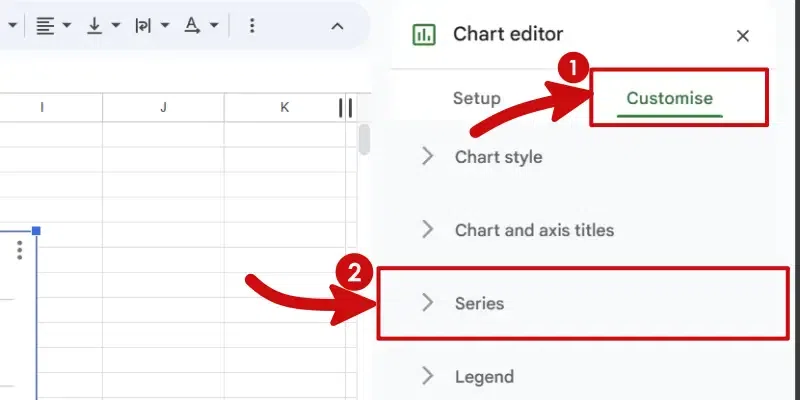
Open series menu
Step 4: Select the Checkbox Next to Error Bars in the Series Dropdown Menu
Scroll down a little in the series menu and find a checkbox option named “Error bars”. Then select the checkbox next to “Error bars” to enable the error bar in the chart.
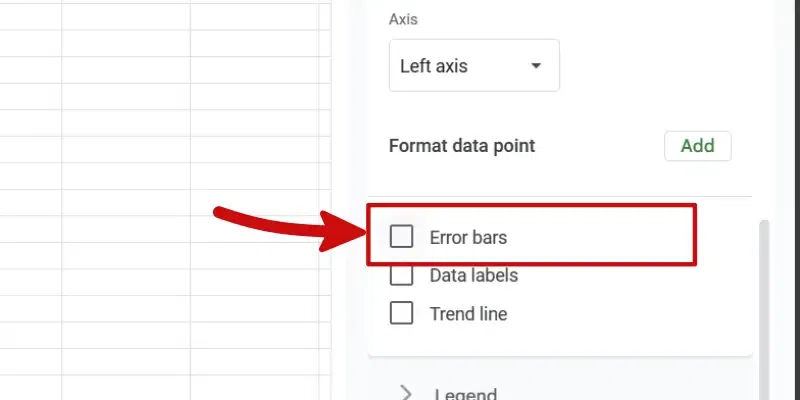
Enable error bars
Step 5: Set the Error Bar Type and Value Input
After enabling the Error bars, you can choose the type of error bar and set the value of the error bar. The option for selecting types and setting values will appear right below the error bar checkbox after you enable it.
By default, the error bar type is Percentage, clicking on it will show a dropdown menu consisting of four options: None, Percentage, Constant, and Standard deviation. You can require an error bar type from the dropdown menu.

Set error bar type and value
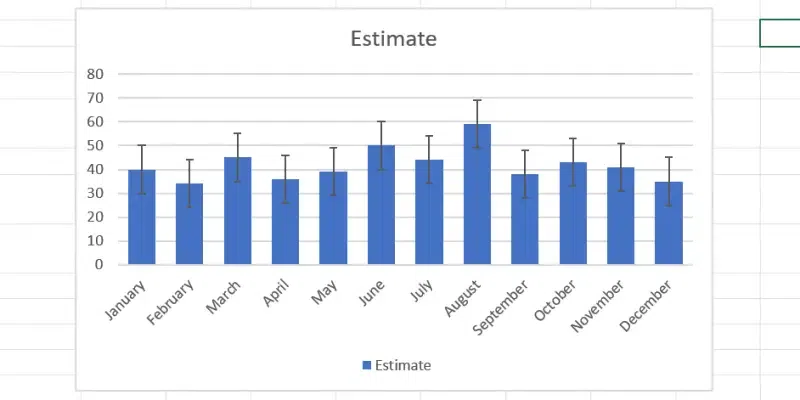
Step 6: Preview Error Bars on the Column Chart
Now you can see the chart with an error bar enabled in it.

Chart with error bars
How to Add Vertical/Horizontal Error Bars In Google Sheets
To add an error bar in vertical or horizontal charts, the same method described above is used. If you want to add a vertical error bar in Google Sheets, insert a vertical chart, then go to the chart editor and enable the error bar.
Chart with vertical error bar
Similarly, to add a horizontal error bar in Google Sheets, insert a horizontal chart, then go to the chart editor and enable the error bar.
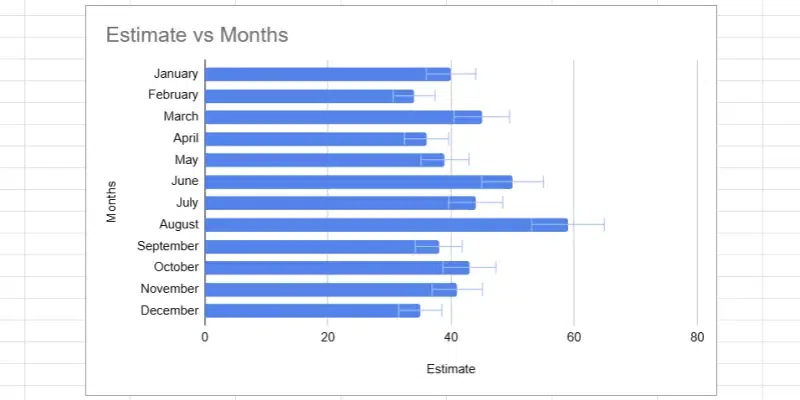
Chart with horizontal error bar
How to Add Error Bars To a Column Chart in Excel
Microsoft Excel is also a feature-rich tool for making spreadsheets. Unlike Google Sheets, which is online-only, Excel is available online and offline. It is very easy to enable error bars in Excel. The step-by-step procedure to enable error bars in Excel is given below.
Step 1: Select the Chart and Add the Error Bar
Open your Excel file and select a column chart. Then click on the “Plus” button to open the chart elements menu. On the chart elements list, you can see the checkbox option next to “Error bars”. Click on it to enable the error bars in the edge.
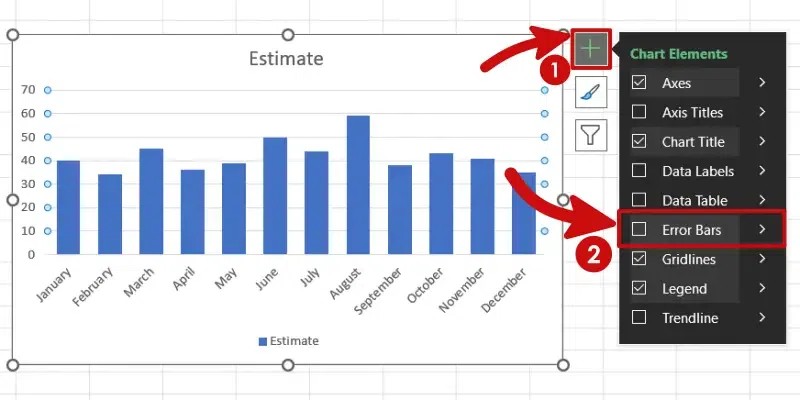
Add error bar in Excel
Step 2: Open More Options
Now, to modify the values of the error bar, select the arrow next to “Error Bars” and then select more options. You can also change the error bar type from the same menu.
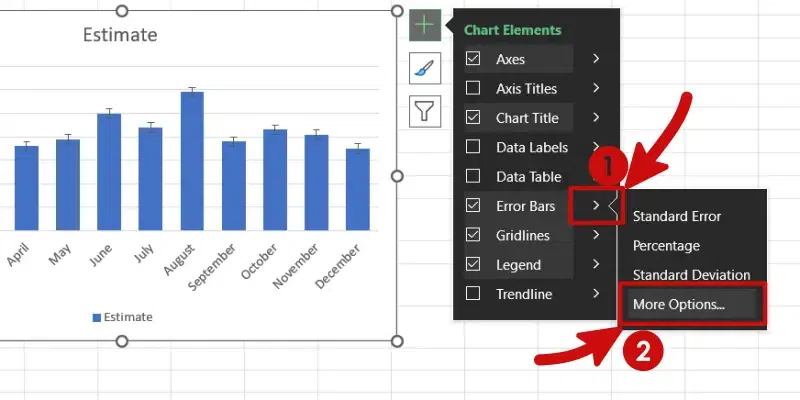
Open “More options” of the Error bar
Step 3: Set the Error Bar Types and Value
Now you can see the Format options of the error bar on the right side of the window. There you can find the options to change the type of error bars and also options to set the value of error. Select your desired error bar type and value.
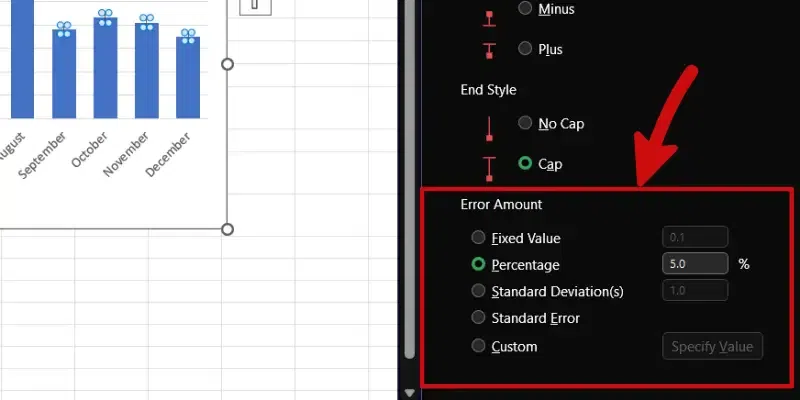
Modify error bar type and value
Step 4: Error bars are displayed
Now you can see the error bar in your chart in Microsoft Excel.
Column chart with error bar in Excel
Types of Error Bars in Google Sheets
There are three types of error bars in Google Sheets. They are explained below:
Percentage
In percentage error bars, a specific percentage of a data point is considered a possible error, and it is marked. For example, if a 10% error is given for a value of 50, then an error bar is drawn from 45-55 (90%-110% of the value).
Constant
In constant error bars, a specific value is considered an error. For example, if 5 is considered a constant error for a value of 100, then the error bar is drawn for ±5. That is, the error bar is drawn from 95-105.
Standard deviation
Standard deviation refers to the average variability of a dataset. Unlike constant and percentage error bars, which are drawn at the end points of a bar, Standard deviation error bars are drawn from the mean value of the dataset. For example, if the mean value is 42 and the standard deviation is 7, then the error bar is drawn from the range 35-49. Another thing to note is that, what you enter in the value column of standard deviation, is multiplied by the standard deviation of the dataset and an error bar will be drawn in that range. Considering the previous example, if you enter value 2, then the range is 28-56, if your value is 0.5, then the range is 38.5-45.5 and if the value is 1, then the range is 35-49, that is how it works.
Conclusion
Error bars play an important role in charts and graphs. It shows the possible error or uncertainty of a measurement. And you can use Google Sheets to easily add error bars to your graphs. We hope the article was insightful for you, and feel free to share your thoughts in the comments!
Frequently Asked Questions (FAQs)
Can I format the error bars in the Google Sheets?
You cannot format the error bar created in Google Sheets.
What are constant error bars in Google Sheets?
Constant error bars are those error bars who have a constant value as its error.
How do you insert error bars?
To add error bars, go to Chart editor>Customise>Series and click on error bars checkbox.
Share your thoughts in the comments
Please Login to comment...