gGally Package in R
Last Updated :
27 Mar, 2023
The gGally is an extension package to ggplot2 which contains functions to reduce the complexity of combining geoms. The plots like Scatterplot Matrix, Parallel Coordinates Plot, etc, While plotting the graphs using the ggplot() function we need to combine the geom() object to specify the type of plot but when it comes to the gGally package it contains some built functions like:
- ggally_density() – To plot Density Plot.
- ggally_points() – To plot the ScatterPlot, etc.
which reduces the complexity of plotting graphs with the geoms like in ggplot2. So, let’s dive into some graphs which can be plotted using GGally in R Programming Language.
R
install.packages("ggplot2")
install.packages("GGally")
library(GGally)
library(ggplot2)
|
Density Plot using GGally
Syntax:
ggally_density(data, mapping)
Where,
- data – data set to be plotted is specified here
- mapping – aesthetics of plot is specified here
R
data(iris)
GGally::ggally_density(iris,mapping=ggplot2::aes(x=Sepal.Length,
y=Sepal.Width)) +
labs(title="Density Plot using GGally")
|
Output:

Density Plot using the gGally Package in R
Facet Density Plot using GGally
Syntax:
ggally_facetdensity(data, mapping)
Where,
- data – data set to be plotted is specified here
- mapping – aesthetics of plot is specified here
R
GGally::ggally_facetdensity(iris[1:10,1:4],
mapping=ggplot2::aes(x=Sepal.Length,
y=Sepal.Width)) +
labs(title="Facet Density Plot using GGally")
|
Output:
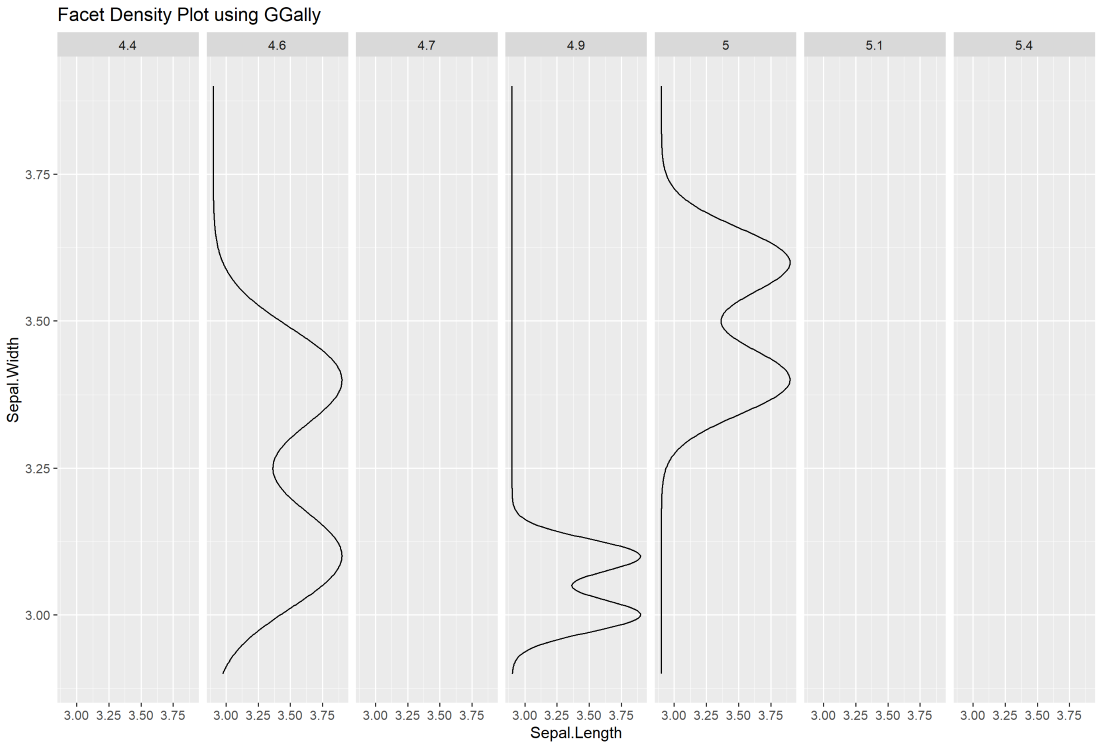
Facet Density Plot using the gGally Package in R
Bar Diagram Using GGally
Syntax :
ggally_barDiag(data, mapping, rescale)
Where,
- data – data set using
- mapping – aesthetics being used
- rescale – boolean to decide whether or not to rescale the count output. Only applies to numeric data
R
GGally::ggally_barDiag(iris,
mapping=ggplot2::aes(x=Sepal.Length))+
labs(title="Bar Diagram using GGally")
|
Output:

Bar Plot using the gGally Package in R
Dot Plot using GGally
Syntax:
ggally_dot(data, mapping)
Where,
- data – data set to be plotted is specified here
- mapping – aesthetics of plot is specified here
R
GGally::ggally_dot(iris[1:4,1:4],
mapping=ggplot2::aes(x=Sepal.Length,
y=Sepal.Width)) +
labs(title="Dot Plot using GGally")
|
Output:

Dot Plot using the gGally Package in R
Scatter Plot using GGally
Syntax:
ggally_points(data, mapping)
Where,
- data – data set to be plotted is specified here
- mapping – aesthetics of plot is specified here
R
GGally::ggally_points(iris,
mapping=ggplot2::aes(x=Sepal.Length,
y=Sepal.Width)) +
labs(title="Scatter Plot using GGally")
|
Output:

Scatter Plot using the gGally Package in R
Network Plot using GGally
Syntax:
ggally_facethist(data, mapping)
Where,
- data – data set to be plotted is specified here
- mapping – aesthetics of plot is specified here
R
GGally::ggally_facethist(iris,
mapping=ggplot2::aes(x=Sepal.Length,
y=Petal.Length)) +
labs(title="Network plot using GGally")
|
Output:
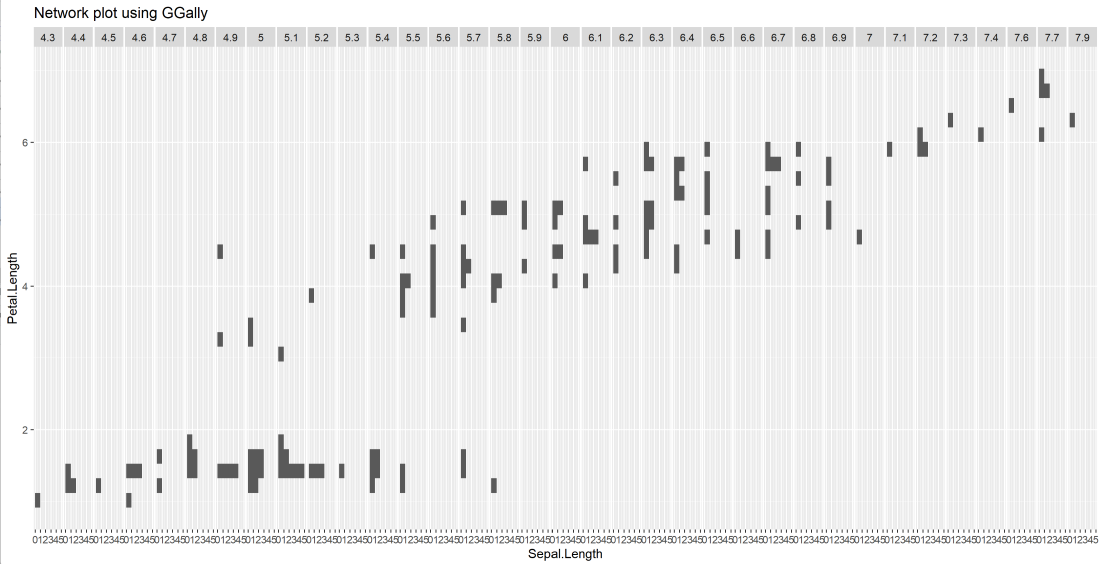
Network Plot using the gGally Package in R
Correlation Plot using GGally
Syntax:
ggally_cor(data, mapping, stars, method, display_grid, digits)
Where,
- data – data set to be plotted is specified here
- mapping – aesthetics of plot is specified here
- stars – Logical value used to display stars based on significance level
- method – correlation method need to be used (pearson)
- display_grid – if TRUE, display aligned panel grid lines. If FALSE (default), display a thin panel border
- digits – Number of digits need to be displayed after decimal point is specified here
R
GGally::ggally_cor(iris,mapping=ggplot2::aes(x=Sepal.Length,
y=Petal.Length),
stars=TRUE,
digits=5,
method="pearson") +
labs(title="Correlation plot using GGally")
|
Output:

Correlation Plot using the gGally Package in R
Pair Plot using GGally
Syntax:
ggpairs(data, mapping, columns, upper, lower, axisLables, ColumnLables)
Where,
- data – data set to be plotted is specified here
- mapping – aesthetics of plot is specified here
- columns – columns used to make plot of a dataset is specified here
- upper & lower – upper and lower are lists that may contain the variables ‘continuous’, ‘combo’, ‘discrete’, and ‘na’
- axisLabels – either “show” to display axisLabels, “internal” for labels in the diagonal plots, or “none” for no axis labels
- columnLabels – label names to be displayed. Defaults to names of columns being used.
R
GGally::ggpairs(iris,
mapping=ggplot2::aes(x=Sepal.Length,
y=Petal.Length)) +
labs(title="Pairs plot using GGally")
|
Output:

Pair Plot using the gGally Package in R
Share your thoughts in the comments
Please Login to comment...