Difference between Frequency Array and Frequency Distribution
Last Updated :
21 Jul, 2023
The number of times a specific value appears in a distribution is known as its frequency. For instance, there are 30 students in a class, and fifteen of them have received 80 points, ten have received 90 points, and five have received 100 points. The frequencies will now be 15, 10, and 5. A table in which frequencies and corresponding values of a variable are written side by side is referred to as a frequency distribution. A frequency distribution can be classified as “Discrete” or “Continuous” based on whether the variable is discrete or continuous.
What is Frequency Array (Discrete Series)?
Discrete Series is a series in which the individual values differ from each other by a definite amount. In this frequency distribution series, different values of the variables are shown with their respective frequencies. The classification of data for a discrete variable is known as Frequency Array. A discrete variable does not take a fractional value but takes just definite integral values.
Discrete Frequency Distribution Construction (using Tally marks)
The method of Tally Bars or Tally Marks is used by the investigator to count the number of observations or the frequency of each value of the variable. The steps involved in the construction of discrete frequency distribution using tally marks are as follows:
- Prepare a table with three columns with headings as Variable, Tally Marks, and Frequency.
- The first column consists of each possible value of the variable.
- The second column includes a tally mark denoted by | for every observation against its corresponding value. If a specific value has occurred for the fifth time, we put a cross on the tally mark (
||||), by cutting the four tally bars and count the line cutting as the fifth number. For the sixth item, we will put another tally bar after leaving some space.
- The third column includes the total of tally marks corresponding to each value of the variable.
Example:
Represent the marks of 22 students of a class in the form of frequency array.
Solution:
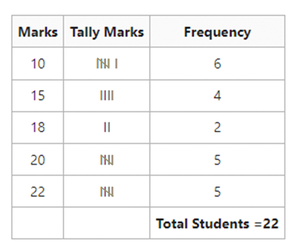
Frequency Array
The data is presented in the form of a frequency array in the table above. According to the table, out of 22 students, 6 students got 10 marks, 4 students got 15 marks, 2 students got 18 marks, 5 students got 20 marks, and 5 students got 22 marks.
The items in such a series are organised in ascending (or descending) order. The frequency is given in front of each item to indicate the number of times the item appears in the series. The marks obtained are shown in ascending order in this table. The frequency of these marks, that is, the number of students who have obtained these marks, is placed beside them.
What is Frequency Distribution (Continuous Series)?
A discrete series cannot take any value in an interval; therefore, in cases where it is essential to represent continuous variables with a range of values of different items of a given data, Continuous Series is used. In this series, the measurements are only approximations and these approximations are expressed in the form of class intervals. The classes are formed from beginning to end, without any breaks.
Other names of Continuous Series are Frequency Distribution, Grouped Frequency Distribution, Series with Class Intervals, and Series of Grouped Data.
Example:
From the marks given below of 30 students, prepare a frequency distribution table with classes 0-10, 10-20, and so on.
Solution:
The steps to construct the frequency distribution table are as follows:
- The first column of the table will include the class intervals starting from 0-10 til 60-70, as the value of the highest observation is 69.
- The second column of the table will include the tally marks.
- The third column of the table will include the frequency of the by counting the tally marks corresponding to the different values.
Difference between Frequency Array and Frequency Distribution
The arrangement of data is shown by the frequency array and frequency distribution, with frequencies as variables corresponding to different values of an X-variable. The key difference is that in the case of frequency arrays, the X-variable must be discrete. In the case of a frequency distribution, X-variable is a distribution with different class intervals rather than a discrete variable.
Example:
In a nutshell, frequency arrays are discrete series that show frequencies corresponding to discrete values, whereas frequency distributions are series that show frequencies corresponding to different class intervals.
Share your thoughts in the comments
Please Login to comment...