What do you mean by Partition Value?
Quartile, Decile, and Percentiles of partition values represent various perspectives on the same subject. To put it another way, these are values that partition the same collection of observations in several ways. As a result, it can divide these into many equal parts. According to the definition of the median, it is the middle point in the axis frequency distribution curve, and it divides the area under the curve into two areas with the same area on the left and right. The area under the curve for four equally divided parts of the area is called quartiles, the area for ten equally divided parts of the area is called deciles, and the area for hundred equally divided parts of the area is named percentiles.
(I) Quartiles
There are several ways to divide an observation when required. To divide the observation into two equally-sized parts, the median can be used. A quartile is a set of values that divides a dataset into four equal parts. The first quartile, second quartile, and third quartile are the three basic quartile categories. The lower quartile is another name for the first quartile and is denoted by the letter Q1. The median is another term for the second quartile and is denoted by the letter Q2. The third quartile is often referred to as the upper quartile and is denoted by the letter Q3.
Simply put, the values which divide a list of numerical data into three quarters are known as quartiles. The center of the three quadrants measures the central point of distribution and displays data that are close to the center. The quartiles represent the distribution or dispersion of the data set as a whole. The formulas for calculating quartiles are:
![Q_{1}=[\frac{N+1}{4}]^{th}~item](https://www.geeksforgeeks.org/wp-content/ql-cache/quicklatex.com-698a974594f74c5a0d4913306c7a4c20_l3.png "Rendered by QuickLaTeX.com")
![Q_{2}=[\frac{N+1}{2}]^{th}~item](https://www.geeksforgeeks.org/wp-content/ql-cache/quicklatex.com-d92bb23515cf908953753ec55e9804ea_l3.png "Rendered by QuickLaTeX.com")
![Q_{3}=[\frac{3(N+1)}{4}]^{th}~item](https://www.geeksforgeeks.org/wp-content/ql-cache/quicklatex.com-a5776de50616dd68f2d8c73d818a103a_l3.png "Rendered by QuickLaTeX.com")
where, n is the total number of observations, Q1 is First Quartile, Q2 is Second Quartile, and Q3 is Third Quartile.
Example 1:
Calculate the lower and upper quartiles of the following weights in the family: 25, 17, 32, 11, 40, 35, 13, 5, and 46.
Solution:
First of all, organise the numbers in ascending order.
5, 11, 13, 17, 25, 32, 35, 40, 46
Lower quartile,
![Q_{1}=[\frac{9+1}{4}]^{th}~item](https://www.geeksforgeeks.org/wp-content/ql-cache/quicklatex.com-71f80a2401827e9c5d15278ab35b09f9_l3.png "Rendered by QuickLaTeX.com")
Q1 = 2.5th term
As per the quartile formula;
Q1 = 2nd term + 0.5(3rd term – 2nd term)
Q1 = 11 + 0.5(13 – 11) = 12
Q1 = 12
Upper Quartile,
![Q_{3}=[\frac{3(9+1)}{4}]^{th}~item](https://www.geeksforgeeks.org/wp-content/ql-cache/quicklatex.com-13ce84c0faf5f75d87cffd5837926863_l3.png "Rendered by QuickLaTeX.com")
Q3 = 7.5th item
Q3 = 7th term + 0.5(8th term – 7th term)
Q3 = 35 + 0.5(40 – 35) = 37.5
Q3 = 37.5
Example 2:
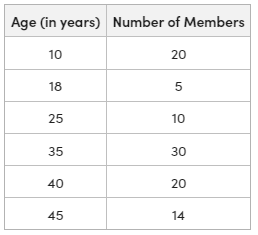
Calculate Q1 and Q3 for the data related to the age in years of 99 members in a housing society.
Solution:

![Q_{1}=[\frac{99+1}{4}]^{th}~item](https://www.geeksforgeeks.org/wp-content/ql-cache/quicklatex.com-d5128de3cb8589d2bfaa7aeadfc9cf9e_l3.png "Rendered by QuickLaTeX.com")
Q1 = 25th item
Now, the 25th item falls under the cumulative frequency of 25 and the age against this cf value is 18.
Q1 = 18 years
![Q_{3}=[\frac{3(99+1)}{4}]^{th}~item](https://www.geeksforgeeks.org/wp-content/ql-cache/quicklatex.com-ea4fb99280b7eb6b1368fcef725bcd7f_l3.png "Rendered by QuickLaTeX.com")
Q3 = 75th item
Now, the 75th item falls under the cumulative frequency of 85 and the age against this cf value is 40.
Q3 = 40 years
Example 3:
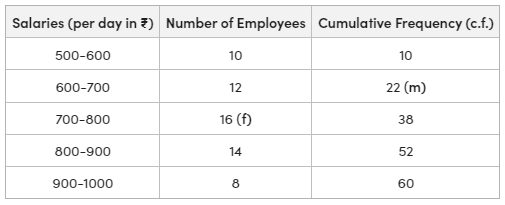
Determine the quartiles Q1 and Q3 for the company’s salary listed below.
Solution:


= 15th item
Now, the 15th item falls under the cumulative frequency 22 and the salary against this cf value lies in the group 600-700.


Q1 = ₹641.67


Q3 = 45th item
Now, the 45th item falls under the cumulative frequency 52 and the salary against this cf value lies in the group 800-900.


Q3 = ₹850
(II) Deciles
The deciles involve dividing a dataset into ten equal parts based on numerical values. There are therefore nine deciles altogether. Deciles are represented as follows: D1, D2, D3, D4,…………, D9. One-tenth (1/10) of every given observation must be less than or equal to D1, for D1 to be the usual highest value. The remaining nine-tenths of the same observation, or 9/10, is, nevertheless, greater than or equal to D1‘s value.
A decile is used to group big data sets in descriptive statistics either from highest to lowest values or vice versa. It takes place on a scale from one to ten, with each number after that representing a rise of ten percentage points. A decile is a type of quantile that, like the quartile and the percentile, divides a set of data into groups that are simple to measure and analyse. In the domains of finance and economics, this kind of data ranking is carried out as a part of several academic and statistical studies. The formulas for calculating deciles are:
![D_{1}=[\frac{N+1}{10}]^{th}~item](https://www.geeksforgeeks.org/wp-content/ql-cache/quicklatex.com-7e6e6e071a8cbe1f395702ff82654e69_l3.png "Rendered by QuickLaTeX.com")
![D_{2}=[\frac{2(N+1)}{10}]^{th}~item](https://www.geeksforgeeks.org/wp-content/ql-cache/quicklatex.com-bda7ab46cb7a686afe5c7f092d4bfd17_l3.png "Rendered by QuickLaTeX.com")
…………![D_{9}=[\frac{9(N+1)}{10}]^{th}~item](https://www.geeksforgeeks.org/wp-content/ql-cache/quicklatex.com-4c56018bc2bd3e46f8db1c1906273bd3_l3.png "Rendered by QuickLaTeX.com")
Where, n is the total number of observations, D1 is First Decile, D2 is Second Decile,……….D9 is Ninth Decile.
Example 1:
Calculate the D1, D5 from the following weights in a family: 25, 17, 32, 11, 40, 35, 13, 5, and 46.
Solution:
First of all, organise the numbers in ascending order.
5, 11, 13, 17, 25, 32, 35, 40, 46
![D_{1}=[\frac{9+1}{10}]^{th}~item](https://www.geeksforgeeks.org/wp-content/ql-cache/quicklatex.com-b6b103eb9d19a23d38601e3cb2b5c781_l3.png "Rendered by QuickLaTeX.com")
D1 = 1st item = 5
![D_{5}=[\frac{5(N+1)}{10}]^{th}~item](https://www.geeksforgeeks.org/wp-content/ql-cache/quicklatex.com-7619d8a7e4ffa52d914a06ff09d688c2_l3.png "Rendered by QuickLaTeX.com")
![D_{1}=[\frac{5(9+1)}{10}]^{th}~item](https://www.geeksforgeeks.org/wp-content/ql-cache/quicklatex.com-a47e46096989970e9ff8ff4e7bc0162f_l3.png "Rendered by QuickLaTeX.com")
D5 = 5th item = 25
Example 2:
Calculate D2 and D6 for the data related to the age (in years) of 99 members in a housing society.
Solution:

![D_{2}=[\frac{2(99+1)}{10}]^{th}~item](https://www.geeksforgeeks.org/wp-content/ql-cache/quicklatex.com-4c0716de8e942a23fc73b39801d1c752_l3.png "Rendered by QuickLaTeX.com")
D2 = 20th item
Now, the 20th item falls under the cumulative frequency of 25 and the age against this cf value is 18.
D2 = 18 years
Similarly ![D_{6}=[\frac{6(N+1)}{10}]^{th}~item](https://www.geeksforgeeks.org/wp-content/ql-cache/quicklatex.com-32762bb39c84ed1bdad9495d534463ff_l3.png "Rendered by QuickLaTeX.com")
![D_{6}=[\frac{6(99+1)}{10}]^{th}~item](https://www.geeksforgeeks.org/wp-content/ql-cache/quicklatex.com-ffdbeb9c899300fab3751cd707591861_l3.png "Rendered by QuickLaTeX.com")
D6 = 60th item
Now, the 60th item falls under the cumulative frequency of 65 and the age against this cf value is 35.
D6 = 35 years
Example 3:
Determine D4 for the company’s salary listed below.

Solution:
In case N is an even number, the following formula is used:
![D_{4}=[\frac{4N}{10}]^{th}~item](https://www.geeksforgeeks.org/wp-content/ql-cache/quicklatex.com-0c9d7a874faca14c3c5dac739b3a8c14_l3.png "Rendered by QuickLaTeX.com")
![D_{4}=[\frac{4(60)}{10}]^{th}~item](https://www.geeksforgeeks.org/wp-content/ql-cache/quicklatex.com-84f34eaebfb5d6d0dfa0e4ee46b29743_l3.png "Rendered by QuickLaTeX.com")
D4 = 24th item
Now, the 24th item falls under the cumulative frequency 22 and the salary against this cf value lies in the group 700-800.


D4 = ₹712.5
(III) Percentiles
Centiles is another term for percentiles. Any given observation is essentially divided into a total of 100 equal parts by a centile or percentile. These percentiles or centiles are represented as P1, P2, P3, P4,……….P99. P1 is a typical value of peaks for which 1/100 of any given data is either less than P1 or equal to P1.
Usually, the percentile formula is used to compare a person’s performance to that of others. Remembering that a candidate’s percentile in tests and scores indicates how they rank among other candidates is important. The ratio of values below the value ‘x’ to all matters is used to determine the percentile of the value ‘x’. The percentiles can be calculated for weight, wealth, and several other factors. The formulas for calculating percentiles are:
![P_{1}=[\frac{N+1}{100}]^{th}~item](https://www.geeksforgeeks.org/wp-content/ql-cache/quicklatex.com-58eff7b624935c7c56a145cfadc41ccd_l3.png "Rendered by QuickLaTeX.com")
![P_{2}=[\frac{2(N+1)}{100}]^{th}~item](https://www.geeksforgeeks.org/wp-content/ql-cache/quicklatex.com-f6268b3b8ecd7057ef5fd1392f3a4291_l3.png "Rendered by QuickLaTeX.com")
![P_{3}=[\frac{3(N+1)}{100}]^{th}~item](https://www.geeksforgeeks.org/wp-content/ql-cache/quicklatex.com-066632089e179c5420c932eebac59b6c_l3.png "Rendered by QuickLaTeX.com")
…………….![P_{99}=[\frac{99(N+1)}{100}]^{th}~item](https://www.geeksforgeeks.org/wp-content/ql-cache/quicklatex.com-cff1eb13804b6045b9455a2f82842236_l3.png "Rendered by QuickLaTeX.com")
Where, n is the total number of observations, P1 is First Percentile, P2 is Second Percentile, P3 is Third Percentile, ……….P99 is Ninety Ninth Percentile.
Example 1:
Calculate the P20, P90 from the following weights in the family: 25, 17, 32, 11, 40, 35, 13, 5, and 46.
Solution:
First of all, organise the numbers in ascending order.
5, 11, 13, 17, 25, 32, 35, 40, 46
![P_{20}=[\frac{20(N+1)}{100}]^{th}~item](https://www.geeksforgeeks.org/wp-content/ql-cache/quicklatex.com-3906a09f4ba58e76f9019486cd994165_l3.png "Rendered by QuickLaTeX.com")
![P_{20}=[\frac{20(9+1)}{100}]^{th}~item](https://www.geeksforgeeks.org/wp-content/ql-cache/quicklatex.com-96684ecc01ceb25f32104c44432eb689_l3.png "Rendered by QuickLaTeX.com")
P20 = 2nd item
P20 = 11
![P_{90}=[\frac{90(N+1)}{100}]^{th}~item](https://www.geeksforgeeks.org/wp-content/ql-cache/quicklatex.com-110574a89e8ca2addb37475034cc8f65_l3.png "Rendered by QuickLaTeX.com")
![P_{90}=[\frac{90(9+1)}{100}]^{th}~item](https://www.geeksforgeeks.org/wp-content/ql-cache/quicklatex.com-e7f558c7edb78902ec5f4ecb52054b29_l3.png "Rendered by QuickLaTeX.com")
P90 = 9th item
P90 = 40
Example 2:
Calculate P10 and P75 for the data related to the age (in years) of 99 members in a housing society.
Solution:

![P_{10}=[\frac{10(N+1)}{100}]^{th}~item](https://www.geeksforgeeks.org/wp-content/ql-cache/quicklatex.com-18d73c665f8cf547afe20f734d751e13_l3.png "Rendered by QuickLaTeX.com")
![P_{10}=[\frac{10(99+1)}{100}]^{th}~item](https://www.geeksforgeeks.org/wp-content/ql-cache/quicklatex.com-a64c3626ae27e62b06a5c3579a0cd594_l3.png "Rendered by QuickLaTeX.com")
P10 = 10th item
Now, the 10th item falls under the cumulative frequency of 20 and the age against this cf value is 10.
P10 = 10 years
![P_{75}=[\frac{75(N+1)}{100}]^{th}~item](https://www.geeksforgeeks.org/wp-content/ql-cache/quicklatex.com-0bf5685e3e67c5ff8bfde16e381f5535_l3.png "Rendered by QuickLaTeX.com")
![P_{75}=[\frac{75(99+1)}{100}]^{th}~item](https://www.geeksforgeeks.org/wp-content/ql-cache/quicklatex.com-2766a1cd721793ba5b666766ac438e8e_l3.png "Rendered by QuickLaTeX.com")
P75 = 75th item
Now, the 75th item falls under the cumulative frequency of 85 and the age against this cf value is 40.
P75 = 40 years
Example 3:
Determine the value of P50 for the company’s salary listed below.
Solution:

In case N is an even number, the following formula is used:
![P_{50}=[\frac{50(N)}{100}]^{th}~item](https://www.geeksforgeeks.org/wp-content/ql-cache/quicklatex.com-7417ba3ddebeeccb41fff141442c2e8b_l3.png "Rendered by QuickLaTeX.com")
![P_{50}=[\frac{50(60)}{100}]^{th}~item](https://www.geeksforgeeks.org/wp-content/ql-cache/quicklatex.com-8dd569c738cf1f4db3cbf73683721aea_l3.png "Rendered by QuickLaTeX.com")
P50 = 30th item
Now, the 30th item falls under the cumulative frequency 38 and the salary against this cf value lies between 700-800.


P50 = ₹750
Share your thoughts in the comments
Please Login to comment...