Find unused JS and CSS code in Microsoft Edge Browser
Last Updated :
13 Sep, 2023
During the development of websites developers may leave some unused JS and CSS code in the production. These unused JS and CSS codes are being downloaded by the browser when the site is visited by the user and can result in slowing down the page loading time, increase in internet consumption or increase in memory consumption.
To detect unused JS and CSS code in Edge you can use Coverage tool. The Coverage tool is a simple tool used to get certain information about unused JS and CSS code in a particular webpage. We can get information such as URL of the code, Type of code(JS or CSS), Total bytes of the code , Unused Bytes of the code and the usage visualization.
How to Open Coverage Tool
To open Coverage tool follow these steps:
Step 1: First open developer tools, right click in the page and click Inspect or you can just press the shortcut keys “Ctrl+Shift+I” or “F12”. A section will appear containing various developer tools.
Step 2: Now press the shortcut key “Ctrl+Shift+P” to access the Run Command menu. Type “coverage” and from the options that appear click Show Coverage. Alternatively you also open Coverage tool by just clicking three dots in the top right corner and navigating to More tools > Coverage from the menu that appears.
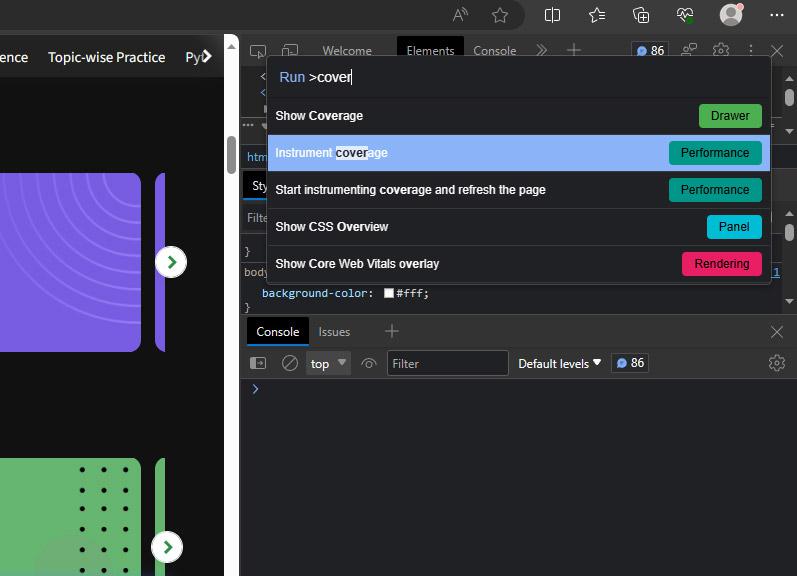
Opening Coverage Tool Using Run Command menu
Understanding various option in the Coverage Tool
Let’s go from left to right and understand each option in Coverage Tool.
- Coverage Granularity: This provide two options to measure the code coverage.
- per block: It means that the coverage tool is measuring the execution of individual lines of code which are often refer to as “blocks” in programming terminology. It has significant overhead which means this option is resources intensive.
- per function: It means that the coverage tool is measuring individual function or method within a program. It has low overhead which means it requires less computing resources.
- Start and Stop Instrument Coverage Button: Instrument coverage means it needs to insert some additional counters into the source code of the site. When you press the Start button the Coverage tool start the Instrumentation process and collects the required information which is shown in the table below the button. The same button turns red indicating that you can stop the coverage whenever required.
- Clear All: This Button clears the whole table containing the coverage information.
- Export Button: Used to export all the data produced by the tool to your device in JSON format.
- URL filter: Used to search specific text in the URL section.
- All or JS or CSS: Used to filter only JS or only CSS or Both.
- Content Scripts: If checked, the coverage tool also check any extension which run in context to that page. Content script means a script which is a part of an extension added in the browser that runs in the context of a particular web page.
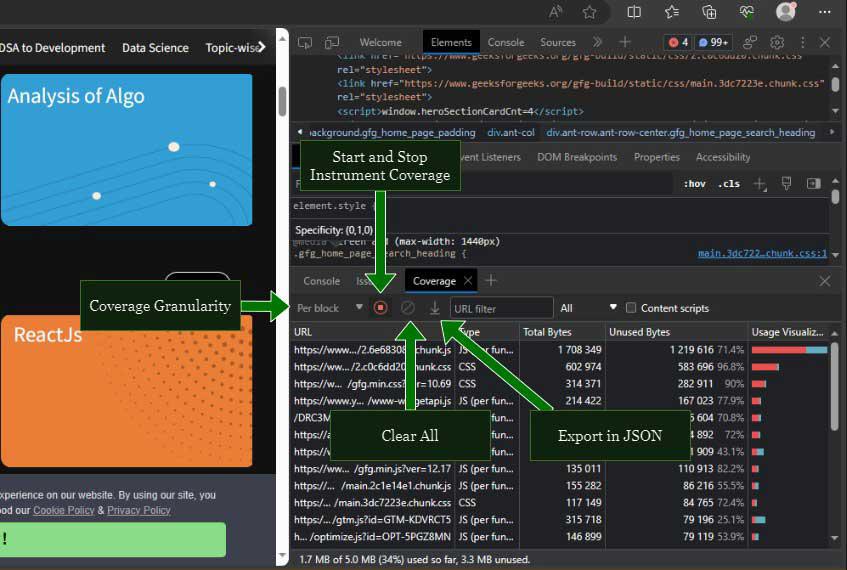
Various Buttons in Coverage Tool
Share your thoughts in the comments
Please Login to comment...