Sources Tool in Microsoft Edge Browser
Last Updated :
30 Oct, 2023
The Sources Tool in Microsoft Edge is used to inspect and edit the JS code present on the web page. You also get debugging tools to debug the code and view the changes live on the web page. It acts as a code editor built into the browser, providing features such as formatting, color code, a file/folder navigator, etc.
The various benefits of the tool are:
- Debugging facility: The tool provides various options and debugging information for the respective file. The debugger provides basic control buttons such as Resume/Pause, Step Over, Step In, and Step Out, and puts the breakpoints for XHR, event listener, and dom mutation breakpoints.
- Format minified code: Most of the code requested by the web page is minified to reduce loading time. You get the option to format the code to make it more readable.
- Navigating around files and folders: You have a navigation sidebar where you can navigate around files and folders on the web page. You also get various tabs for viewing overrides or frequently used snippets.
- Preview changes: You can view the changes in the browser itself without any configuration. The changes made in the code will be reflected on the web page after reloading it.
- Export the changed code: Any file you want to save can be saved in your system by using the Save as option. This saves time in making changes to the original source code and also provides a physical file to share with others.
The Sources tool is present by default as a tab in DevTools. The DevTools can be opened in Edge using the shortcut F12 or “Ctrl+Shift+I.” Alternatively, you can right-click on the webpage and then select Inspect to open DevTools.
Opening the Sources Tool in Edge
The tool can be separated into three sections: the navigator sidebar, the editor section, and the debugger sidebar. The sidebars can be toggled by pressing the buttons present in the top corners of the Editor section.
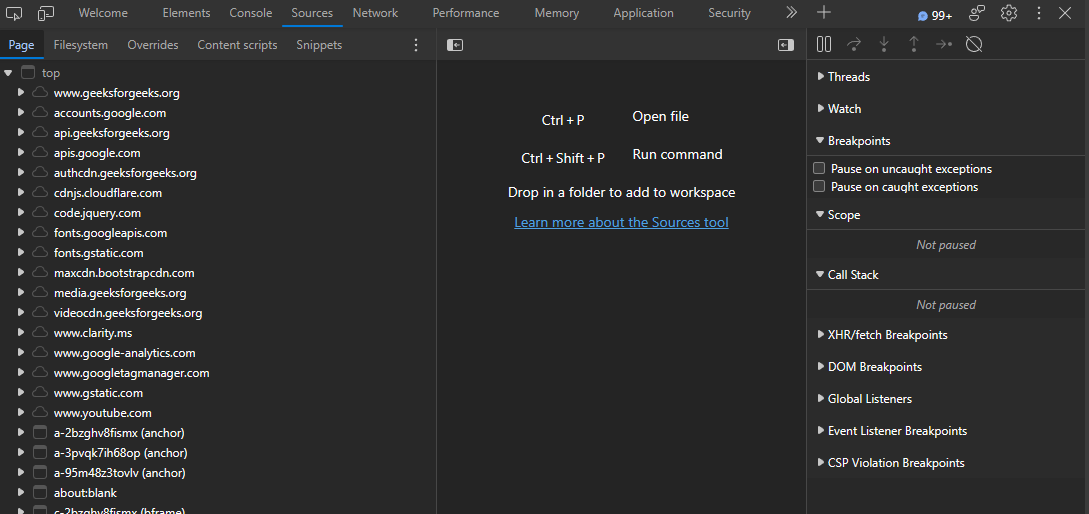
UI of the Sources Tool
Navigator Sidebar:
The navigator sidebar provided various panes to navigate around the files and folders.

Navigator Sidebar
- Page: This tab provides various files under the folder name of their origin. It is mainly used to open the web page files and other iframe files that are present on the page.
- Filesystem: It allows you to add files in a workspace so that the source files can directly be changed in the sources tool. It’s very useful to save time, as before you were making the same changes in the source code that were already made in the sources tool.
- Overrides: Any file set for override content appears here to be modified accordingly. The changes made in the file are reflected on the web page after a refresh, and the browser also ignores any changes made by the server.
- Content scripts: This provides the list of content scripts for the extensions. Content scripts are JS scripts that run in the context of web pages.
- Snippets: This pane allows you to create and view your own JS code snippets that are being saved in your system. It is useful to save JS code that is important to you and is run regularly by you.
Editor section:
This section presents the contents of the selected file. You get all the opened files in tabs, so it gets very easy to switch between the files. The presented code is color code, and at the bottom of the editor, you get the cursor’s line number, column number, and coverage information of the file. You can edit the file by right-clicking the file or the code in the edit and selecting Override Content. This will take you to the Overrides pane in the navigator sidebar.
- Go to: To go to a specific line, press “Ctrl+G” and enter the line number.
- Find: To search for a specific pattern, press “Ctrl+F” and enter the pattern to search.
- Format: To format, press the format “{ }” button present at the bottom left corner of the editor.
- Open: To open a specific file, press “Ctrl+P” and enter the file name.
- Save: To save the edited file, press “Ctrl+S.”.
- Undo and Redo: To undo or redo the changes, press “Ctrl+Z” and “Ctrl+Y”, respectively.
- Breakpoint: To add a breakpoint to a line, hover around the space on the left of the line number and click when a red dot appears.

Editor section
Debugger Sidebar:
The Debugger provides various buttons for debugging and panes providing information related to expressions and breakpoints.
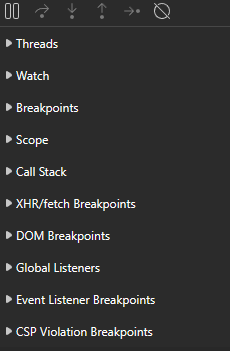
Debugger Sidebar
- Buttons: The various debugging buttons present are:
- Resume/Pause: Click it to pause or resume the execution of the file you are debugging. You can also use the shortcut key F8 or “Ctrl+\”.
- Step over: Click it to move over to the next function call of the executing code. You can also use the shortcut key F10 or “Ctrl+'”.
- Step into: Click it to move into the next function of the executing code. You can also use the shortcut key F11 or “Ctrl+.”.
- Step out: Click it to move out of the current function of the executing code. You can also use the shortcut keys “Shift+F11” or “Ctrl+Shift+;”.
- Step: Click it to move to the next line of the executing code. You can also use the shortcut key F9.
- Deactivate breakpoints: Click this button to disable all the breakpoints so that the execution takes place normally. You can also use the shortcut key “Ctrl+F8”.
- Panes: The various panes present are:
- Threads: Provides a list of various threads running on the web page.
- Watch: You can use the add button to add expressions and variables to monitor their values during debugging while you step through the code.
- Breakpoints: Provides the list of breakpoints added. You also get checkboxes to pause on exceptions and pause on caught exceptions. You also have a cross button for every breakpoint to remove that breakpoint.
- Scope: Various scope-related information when execution comes under the function, method, etc. is mentioned under this pane.
- Call Stack: Provides the list of functions, along with the file name, that were executed to reach the debugging code.
- XHR/fetch Breakpoints: You can add URLs or keywords that will break when an XHR request is made.
- DOM Breakpoints: In the DOM section in the elements tab, you can add breakpoints to elements that break when modifications are made to the elements. The breakpoints are subtree modification, attribute modification, and node removal, which can be set by right-clicking the elements and selecting the required breakpoints from the break menu. All the DOM breakpoints are listed under this pane, which you can enable or disable by clicking on the checkbox or remove by clicking the cross icon.
- Global Listeners: Provides the list of global listeners present on the web page. You get the option to remove the event listener and a link to open the respective function in the editor.
- Event Listener Breakpoints: You get a list of various event listeners present on the web page with checkboxes that can be checked to add breakpoints to the event handler.
- CSP Violation Breakpoints: This provides a list of Content Security Policy (CSP) violations, and you also get checkboxes to display sink or policy violations.
Let’s visit the GFG site and view and edit its code in the Sources tab.
Step 1: Using Edge visit the GFG page and open the sources tool.
Step 2: In the tool open the file and set Override content to edit the file as you require.
Using the Sources Tool
Conclusion
To view, edit or debug the JS code of the web page you need to switch to you code editor but Edge provides a built-in code editor called Sources as a tool. The Sources tool provide navigation and debugging sidebar to navigate around the files and folder and use the debugging options to debug the code.
Share your thoughts in the comments
Please Login to comment...