Performance Tool in Microsoft Edge Browser
Last Updated :
30 Oct, 2023
The Performance Tool in Edge provides views, graphs, charts, timelines, and various other information related to the web page’s performance. The tool records the performance and displays it in a timeline view along with various graphs, charts, and other views that can be used to inspect networks, frames, threads, etc. running on the web page. It’s an excellent visual representation of the performance of the site and the browser, which helps the developers improve their site performance for a fast and responsive user experience.
The various benefits of the performance tool are:
- Resources Information: The tool gives an idea of the various resources used and their sizes on the site. These help you inspect various resources and use the information to improve performance.
- Import and export profile: You can import or export the profiling information in .json or .devtools format. This allows you to save the profile for later use and share it with others.
- Various Graphs and Views: The tab provides various pie charts, graphs, and timelines to study the performance of the web page. You can also focus on a particular section in the timeline, which helps you focus on a particular time range.
- Timeline screenshots: You also get the option to enable screenshots, which, when checked, capture screenshots during profiling and are displayed along with the timeline. You can hover over these screenshots to get a magnified view.
- Memory Information: You can check the memory option to view graphs related to the JS heap, documents, nodes, listeners, and GPU memory. This helps to check how memory usage changes over a range of timelines.
The tool is present as a tab in DevTools. The DevTools can be opened in Edge using the shortcut F12 or “Ctrl+Shift+I.” Alternatively, you can right-click on the webpage and then select Inspect to open DevTools. In DevTools, there are multiple ways to open the tool, which are:
- Using the Add button: At the end of the main toolbar, you will find an Add button (+). If you click the add button, you will find a list of tools. From that list, click Performance.
- Using More Tools: In the top-right corner of DevTools, there will be three vertical dots. Click on them. Then navigate to More Tools > Performance from the menu that appears.
- Using Run Command: To open the run command, use the shortcut “Ctrl+Shift+P” or select Run Command from the menu in the three dots button, which is present in the top-right corner of DevTools. In the Run Command search menu, type Performance, and then select Show Performance from the list of options that appears.
Opening the Performance Tool in multiple ways.
The Performance Tool can be separated into three sections that are Options, Activity section and View section.
1. Options:
The various options provided at the top of the tool are:

Various options in the Performance Tool
- Record: Click it to start a new profile. You can also use the shortcut “Ctrl+E.”.
- Refresh: Click it to start profiling, but also reload the page. You can also use the shortcut “Ctrl+Shift+E.”.
- Clear: Click it to clear all recordings.
- Load profile: Click it to import profiles dev tools or.json file format.
- Save profile: Click it to export profiles in JSON format.
- Timeline sessions: Provides a drop-down list of all recently profiled sessions.
- Screenshots: If checked, the screenshots will be displayed below the timeline.
- Memory: If checked, a pane appears with a graph of the JS head, document, nodes, listeners, and GPU memory.
- Collect garbage: Click it to force the browser to collect garbage.
- Capture settings: The various options provided in it are:
- Disable JS samples: options If checked, then in the activity section under main activity, the call stack is no longer displayed, which reduces overhead during profiling.
- CPU: You can select to reduce the CPU speed to emulate mobile devices or low-end systems.
- Hardware concurrency: If checked, you are allowed to change the value reported by the navigator. hardwareConcurrency.
- Enable advanced rendering instrumentation: If checked, then it will view detailed paint instrumentation.
- Network: You can select various network speeds to emulate the different network speeds of a wide range of users.
2. Activity section:
This section provides a timeline, activity information and memory graphs if memory option is checked.
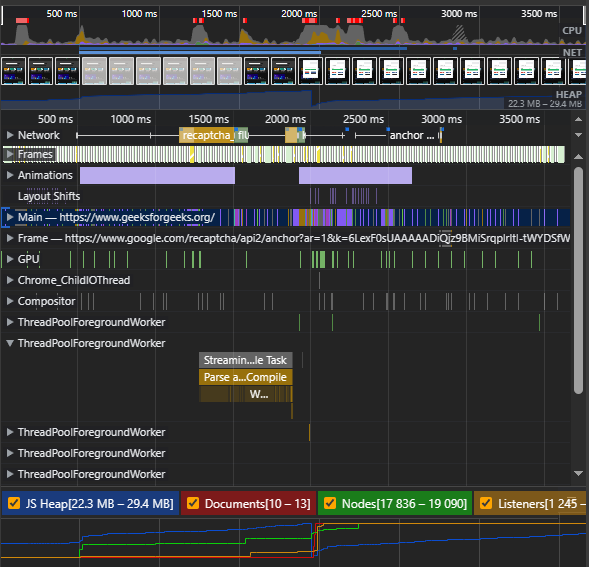
Activity Section
- Timeline: The timeline present the activities graph with respect to time in milliseconds. If screenshots option is checked then the screenshots are also displayed with respect to timeline. You can drag a range in the timeline to inspect activities happening in a specific time range. Double-click to reset the range back to the whole timeline.
- Activity information: You get various bars representing various files or activities related to activity category such as network, frames, main thread, GPU, other thread etc.
- Memory Graphs: If the memory option is checked then this pane appears displaying graph of JS head, document, nodes, listeners and GPU memory.
3. View section:
This section provides various views that are:
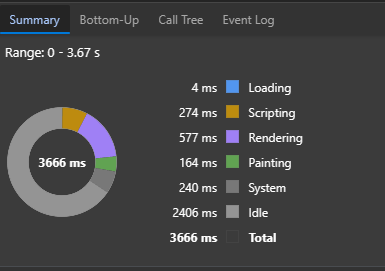
View Section
- Summary: Present information on layout, and for other activities, a pie chart is displayed with timing information for various activities such as loading, scripting, rendering, etc.
- Bottom-up: This view displays activities that spent the most time. You can filter the information, group the information, or toggle a sidebar listing the heaviest tasks.
- Call Tree: This view displays activities that cause the most work for the selected activity category. You can filter the information, group the information, or toggle a sidebar listing the heaviest tasks.
- Event Log: This view displays the order in which the activities occurred during profiling. You can filter the information by text, speed, and activity type.
- Selector Stats: This displays the statistics of the CSS rule selectors that are involved in a single Recalculate Style.
Let’s visit the GFG site and view various activities using the Performance Tool.
Step 1: Using Edge, visit the GFG site and open the Performance Tool.
Step 2: In the tool, start profiling and stop to inspect activities occurring within a time range.
Using the Performance Tool in the GFG site
Conclusion
A site’s popularity and user friendliness depend not only on its look but also on how it performs in the users browsers with respect to various systems and networking configurations. You can make the site fast and responsive by inspecting it with the performance tool provided by Edge.
Share your thoughts in the comments
Please Login to comment...