Network Conditions Tool in Microsoft Edge Browser
Last Updated :
30 Oct, 2023
The Network Conditions Tool provides various options to simulate the various network conditions, which helps to check the web page behavior in real-life situations where the network conditions vary a lot. The conditions the toll provides are disabling cache, network throttling, user agents, and accepted content encodings.
The various benefits of the tool are:
- Fast and Easy to Use: The tool is very simple and can be used by anyone with little knowledge. Any changes you make to the tool are reflected instantly on the web page.
- Network-related UX improvement: The users have devices with varied network configurations and settings. To improve the user experience, the tool helps a lot to simulate these conditions.
- Network requests and responses debugging: You can use this tool along with the network tool to check for problems during requests and responses when network conditions vary.
The Network Conditions tool is present in DevTools, and you can open it by pressing F12 or “Ctrl+Shift+I” or right-clicking on the webpage and then pressing inspect from the context menu that appears. In DevTools, there are multiple ways to open the tool, which are:
- Using the Add button: At the end of the main toolbar, you will find an Add button. Click the add button and select network conditions from the list of tools that pops up.
- Using More Tools: In the top-right corner of DevTools, click the three dots. Then navigate to More Tools > Network Conditions from the menu that appears.
- Using Run Command: Press the shortcut key “Ctrl+Shift+P” or select Run Command from the menu in the three dots button, which is present in the top-right corner of DevTools. The Run Command search menu will appear. In that, type Network, and then select Show Network Conditions from the list of options that appears.
Opening Network Conditions Tool in multiple ways
The various network-related options provided by the tool are:
- Caching: If disable cache is checked, then the browser will not cache resources so that you can inspect the raw requests and responses of the web page.
- Network throttling: You can emulate various network speeds, such as fast/slow 3G and offline, using this drop-down list. You can also add your own custom profile by providing a name, download/upload, and latency.
- User agent: You can change the user agent of your web page if it requires a user agent string to render. You get a predefined user agent, but if you want, you can also add a custom user agent by changing the name and pressing the update button after changing the user agent client hits, which are:
- User agent: Here you can add the browser brand name and significant version. Use the add and delete button to add or remove multiple brand and version pairs.
- Full version list: Here you provide the browser brand name and version of various devices that the browser supports. Use the add and delete button to add or remove multiple brand and version pairs.
- Full browser version: Provide the full version of the browser that is traditionally used by the browser’s developers and not advertised to the public.
- Platform: Here you provide the platform name, such as Windows or Android, along with the version of the platform.
- Architecture: Here you provide the CPU architecture, such as x64 or x86.
- Device model: Here you provide the device name and check the mobile checkbox if it’s a mobile.
- Accepted Content-Encodings: You can change the content-encoding HTTP header values that are supported by the browser. This header is mainly used to compress the web page files downloaded over HTTP by the browser.
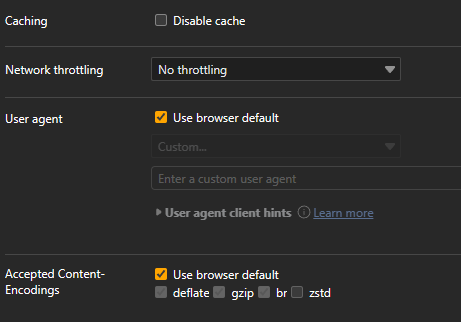
Various options in Network Conditions Tool
Let’s use the Network Conditions Tool to simulate various conditions for the GFG site.
Step 1: Using Edge, visit the GFG site and then locate the Network Conditions Tool in DevTools.
Step 2: Use the tool to change various network-related options and test the site for network requests and response problems in the Network tab.
Conclusion
The developer may be required to test the web page for various network conditions relating to the real user’s network, but instead of using any tool or testing on multiple devices, the network conditions can be simulated in the Edge browser. The Edge browser provides a Network Conditions tool where you can simulate various network conditions.
Share your thoughts in the comments
Please Login to comment...