Data Blending in Tableau
Last Updated :
17 Feb, 2021
Tableau is a commercially available software used in business intelligence to visualize data interactively and understand and deal with it better. It is used for data analysis to finally help draft plans or inferences a company may need to understand themselves.
Data blending is a powerful tool supported by Tableau which allows visualizing data sets from separate data sources together in one picture. This article is dedicated to provide a step-by-step procedure for the same.
Data sources in use:
For the example given below, two data sources are used that are by default available with Tableau:
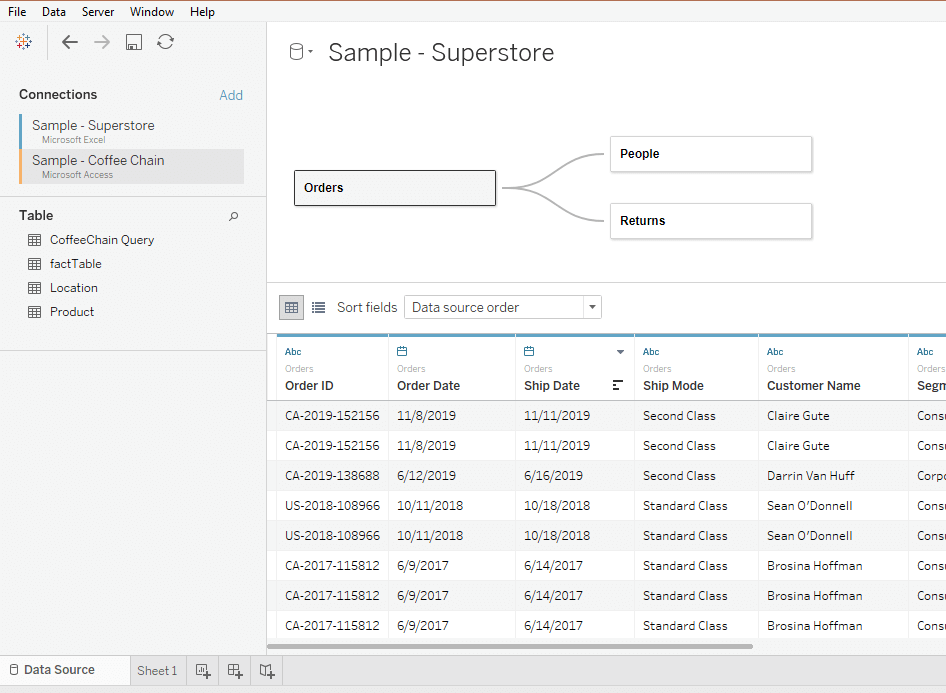
- Sample- Superstore
- Sample- Coffee chain
Approach
- Start application
- Load Primary data source
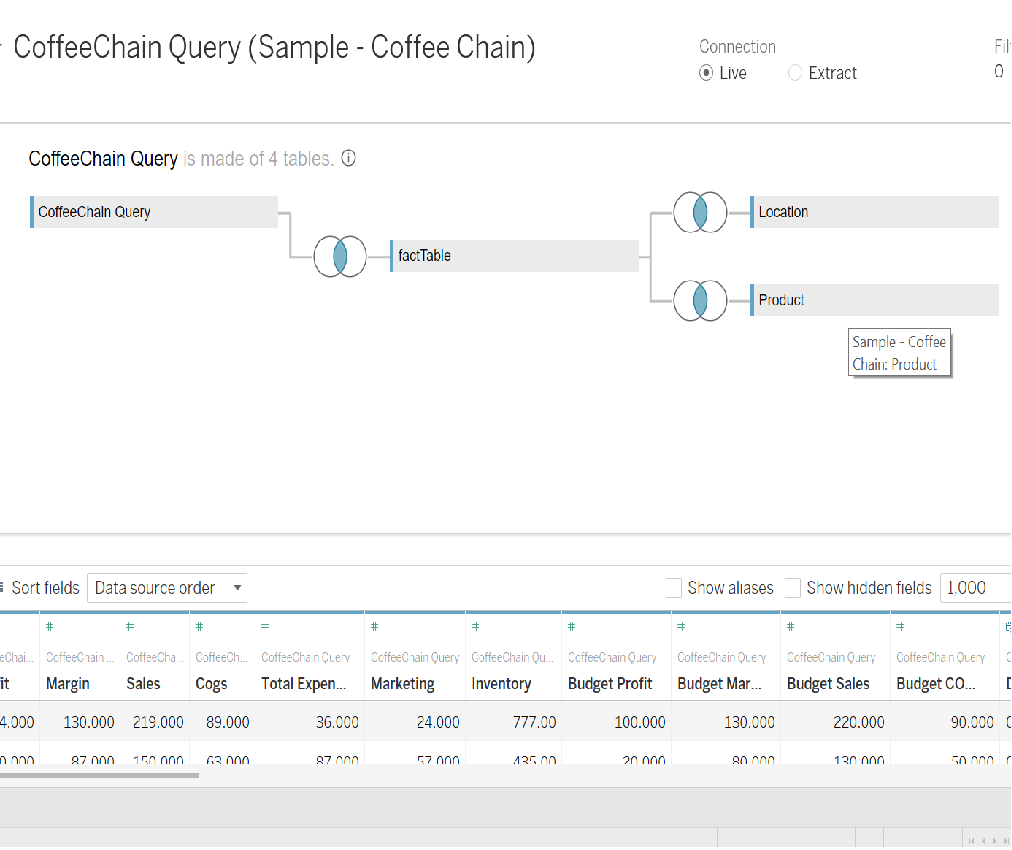
- Load secondary data source
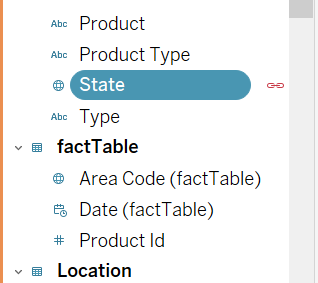
- Blend or combine data based on a common dimension
- The field that is common in both data sources will have a link image in front of it
- Drag this field for further computation
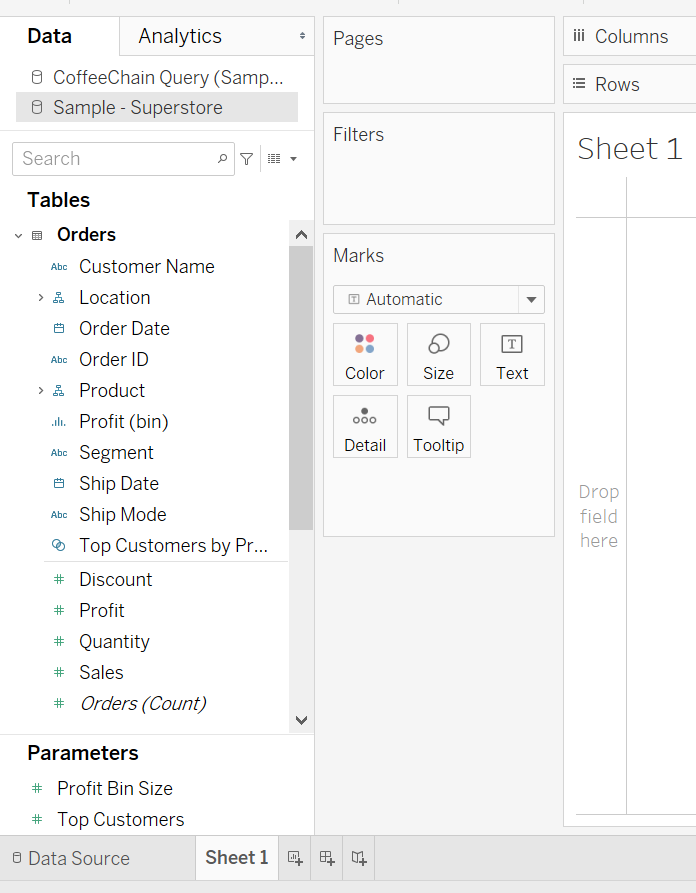
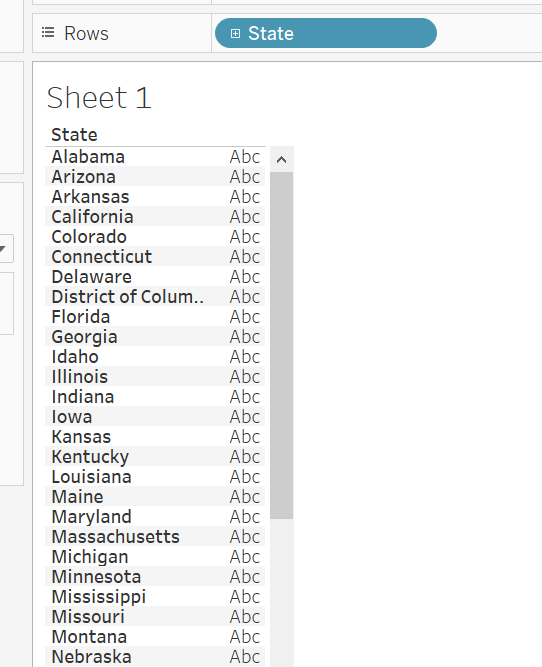
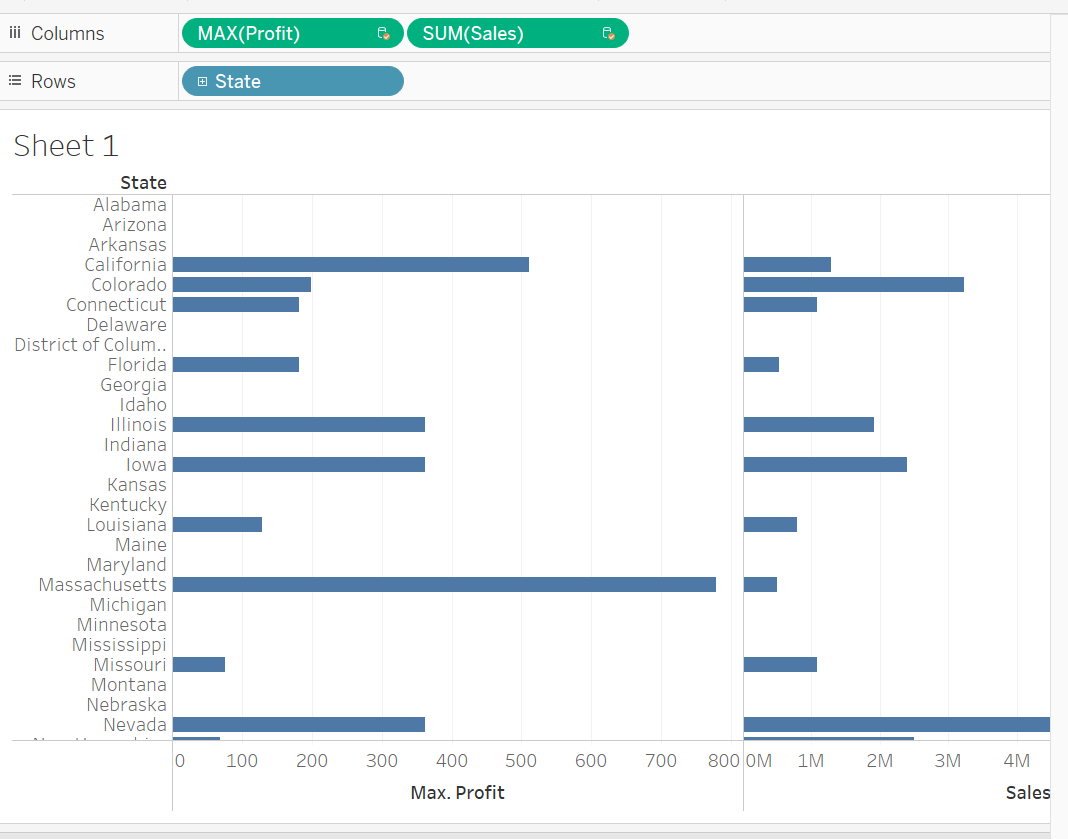
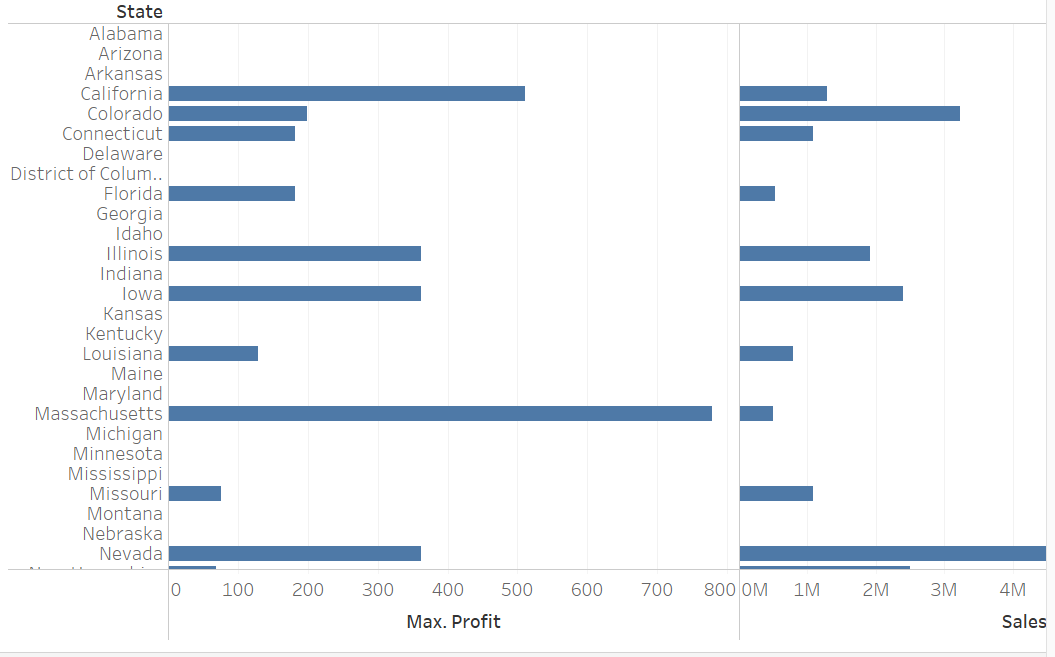
- Choose your required plot representation and all other requirements
- Your visualization is ready
Share your thoughts in the comments
Please Login to comment...