Creating a Personal Finance Manager App with React and Chart.js
Last Updated :
15 Feb, 2024
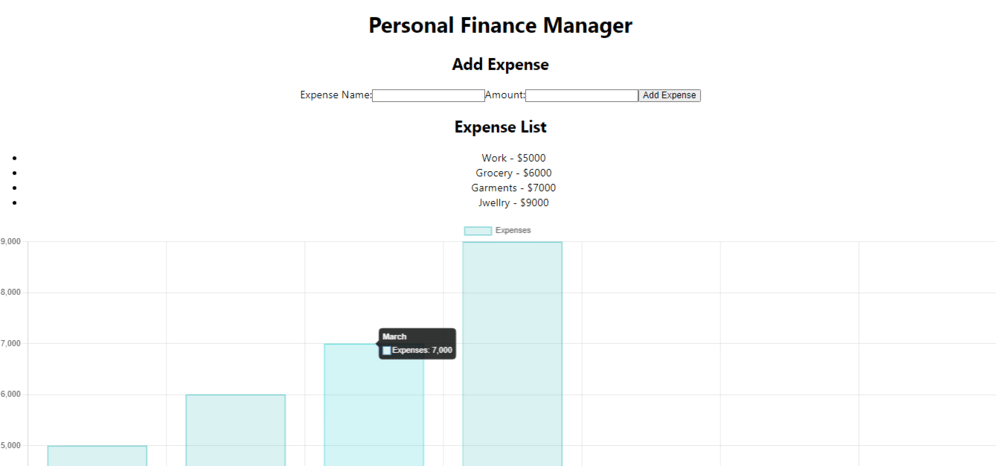
We will explore how to build a simple yet powerful Personal Finance Manager App using React.js for the frontend and Chart.js for visualizing financial data. Managing personal finances effectively is crucial for financial stability and growth.
Preview of Final Output:
Steps to Creating a Personal Finance Manager App with React and Chart.js
Step 1: Create a new React JS project using the following command
npx create-react-app <<Project_Name>>
Step 2: Change to the project directory.
cd <<Project_Name>>
Step 3: Install the requires modules
npm install chart.js
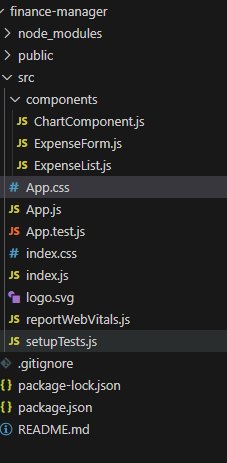
Step 4: Create a folder called components in src directory and create the following files inside it Add ExpenseForm.js, ExpenseList.js, ChartComponent.js and import in App.js
Project Structure:
The updated dependencies in package.json will look like this:
"name": "finance-manager",
  "version": "0.1.0",
  "private": true,
  "dependencies": {
    "@testing-library/jest-dom": "^5.17.0",
    "@testing-library/react": "^13.4.0",
    "@testing-library/user-event": "^13.5.0",
    "chart.js": "^4.4.1",
    "react": "^18.2.0",
    "react-dom": "^18.2.0",
    "react-scripts": "5.0.1",
    "web-vitals": "^2.1.4"
Example: Write the following code in respective files.
- App.js: This component is responsible, for rendering the layout of the application.
- ExpenseList.js: This component returns JSX, which represents the structure and content of the component.
- ExpenseForm.js: The ExpenseForm component is a functional component in React used for adding expenses to a list. This component streamlines the process of adding expenses in a personal finance management application.
- ChartComponent.js: The ChartComponent is a React functional component responsible for rendering a chart using the Chart.js library. This component also handles the cleanup by destroying the chart instance when the component unmounts, ensuring efficient memory management.
Javascript
import React, { useState } from 'react';
import './App.css';
import ExpenseForm from './components/ExpenseForm';
import ExpenseList from './components/ExpenseList';
import ChartComponent from './components/ChartComponent';
function App() {
const [expenses, setExpenses] = useState([]);
const addExpense = (newExpense) => {
setExpenses([...expenses, newExpense]);
};
return (
<div className="App">
<h1>Personal Finance Manager</h1>
<ExpenseForm addExpense={addExpense} />
<ExpenseList expenses={expenses} />
<ChartComponent expenses={expenses} />
</div>
);
}
export default App;
|
Javascript
import React, { useState } from 'react';
function ExpenseForm({ addExpense }) {
const [expenseName, setExpenseName] = useState('');
const [expenseAmount, setExpenseAmount] = useState('');
const handleNameChange = (event) => {
setExpenseName(event.target.value);
};
const handleAmountChange = (event) => {
setExpenseAmount(event.target.value);
};
const handleSubmit = (event) => {
event.preventDefault();
if (!expenseName || !expenseAmount) return;
addExpense({ name: expenseName, amount: parseFloat(expenseAmount) });
setExpenseName('');
setExpenseAmount('');
};
return (
<div>
<h2>Add Expense</h2>
<form onSubmit={handleSubmit}>
<label>
Expense Name:
<input
type="text"
value={expenseName}
onChange={handleNameChange}
/>
</label>
<label>
Amount:
<input
type="number"
value={expenseAmount}
onChange={handleAmountChange}
/>
</label>
<button type="submit">Add Expense</button>
</form>
</div>
);
}
export default ExpenseForm;
|
Javascript
import React from 'react';
function ExpenseList({ expenses }) {
return (
<div>
<h2>Expense List</h2>
<ul>
{expenses && expenses.map((expense, index) => (
<li key={index}>
{expense.name} - ${expense.amount}
</li>
))}
</ul>
</div>
);
}
export default ExpenseList;
|
Javascript
import React, { useEffect, useRef } from 'react';
import Chart from 'chart.js/auto';
function ChartComponent({ expenses }) {
const chartRef = useRef(null);
let myChart = null;
useEffect(() => {
const ctx = chartRef.current.getContext('2d');
if (myChart) {
myChart.destroy();
}
myChart = new Chart(ctx, {
type: 'bar',
data: {
labels: ['January', 'February', 'March', 'April', 'May', 'June', 'July'],
datasets: [{
label: 'Expenses',
data: expenses.map(expense => expense.amount),
backgroundColor: 'rgba(75, 192, 192, 0.2)',
borderColor: 'rgba(75, 192, 192, 1)',
borderWidth: 1
}]
},
options: {
scales: {
y: {
beginAtZero: true
}
}
}
});
return () => {
myChart.destroy();
};
}, [expenses]);
return (
<div>
<canvas ref={chartRef} />
</div>
);
}
export default ChartComponent;
|
Steps to run the project:
Step 1: Type the following command in terminal.
npm start
Step 2: Open web-browser and type the following URL
http://localhost:3000/
Output:
Share your thoughts in the comments
Please Login to comment...