Connecting Multiple Data Tables in Power BI
Last Updated :
01 Mar, 2024
When you get data with different and multiple tables, you will look forward to knowing how these data relate to each other and have any relationship. Power BI helps us to understand with easy steps.
- Transform the data if you have to make changes and then load it.
- Power BI creates the relationship between the tables themselves.
- To view the relationship, click on the Model view tab on the left side of the Power BI.
Power BI helps you import the information containing the various tables into Power BI. You can import data from sources like Excel and CSV or associate it straightforwardly with online administrations.
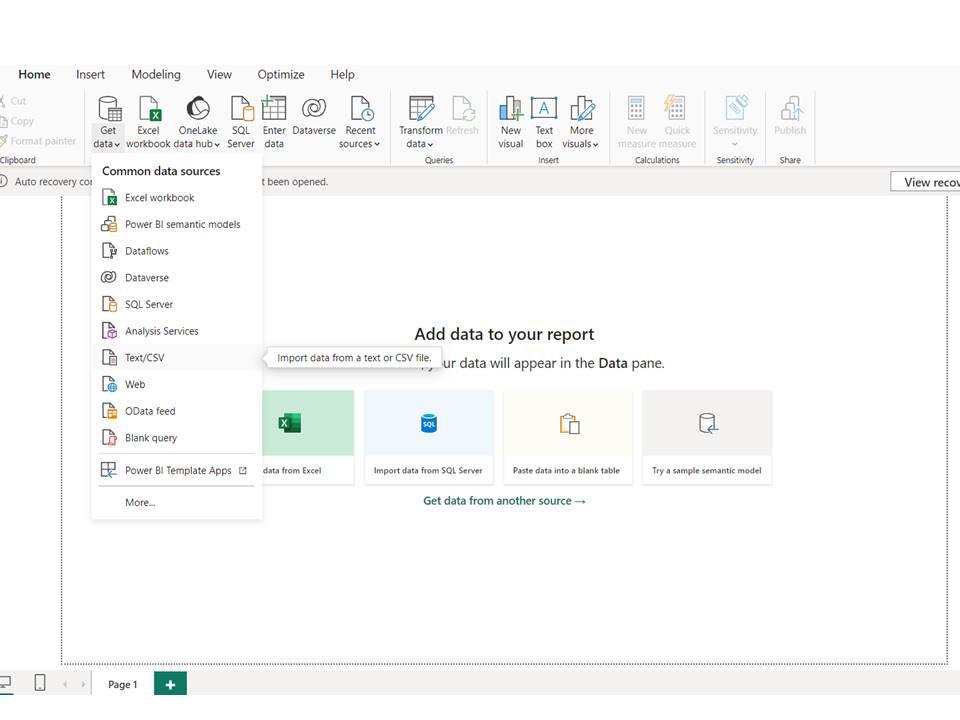
Importing the data
One can either create new table by the help of Data Analysis Expression formulas (DAX) to add the values from the loaded tables or create a relationship.
Building a Relationship by Adding CSV Data
Click on Get data tab and load the file, one can transform the data before loading and then load it and can visualize the data in the dashboard.
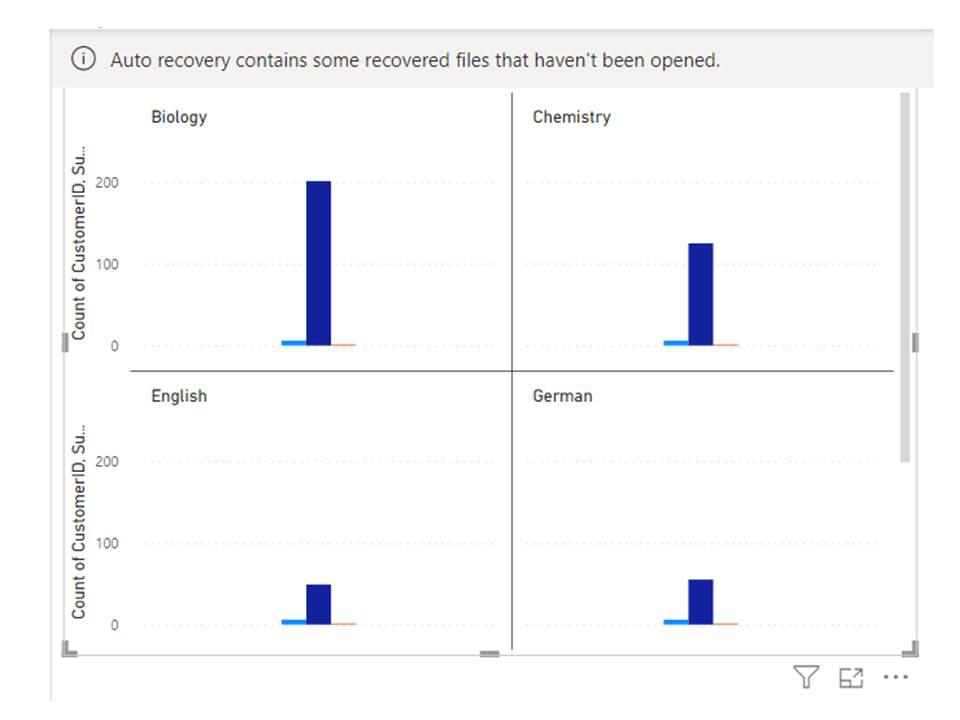
Data Visualization
Now the question arises how does Power BI make a relationship between tables?
Relationship between Tables
- It has the same column names or has some unique values.
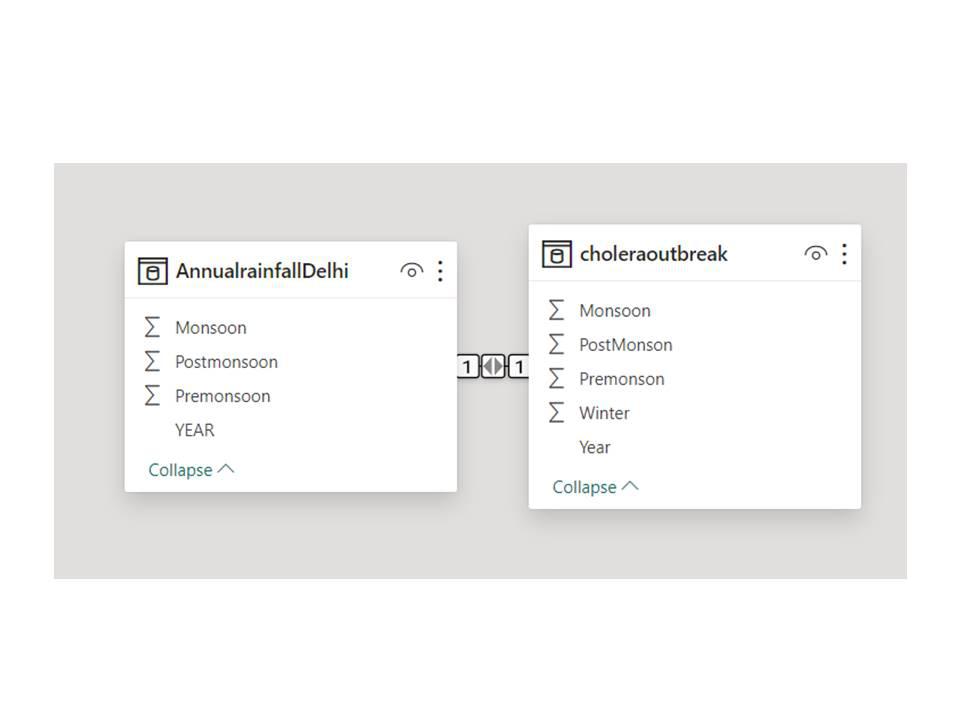
- Let’s see what relationship is there between the tables.
- When you expand the toggle button between the two tables, it shows the relationship the two tables have in between them.
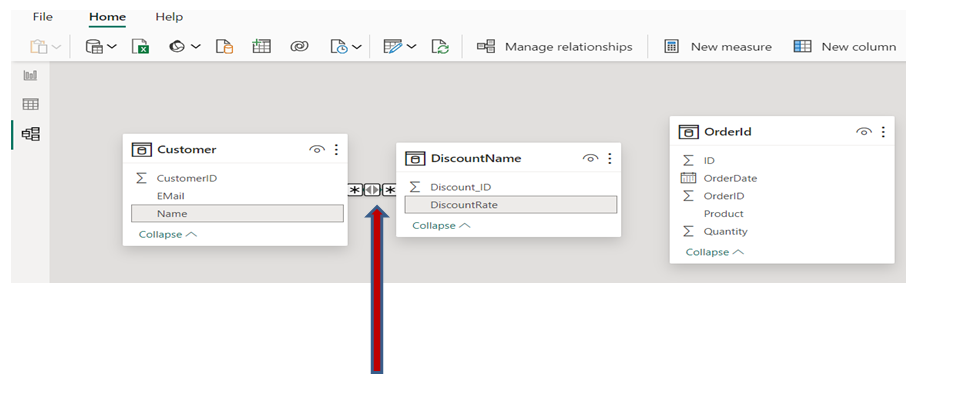
Toggle Button
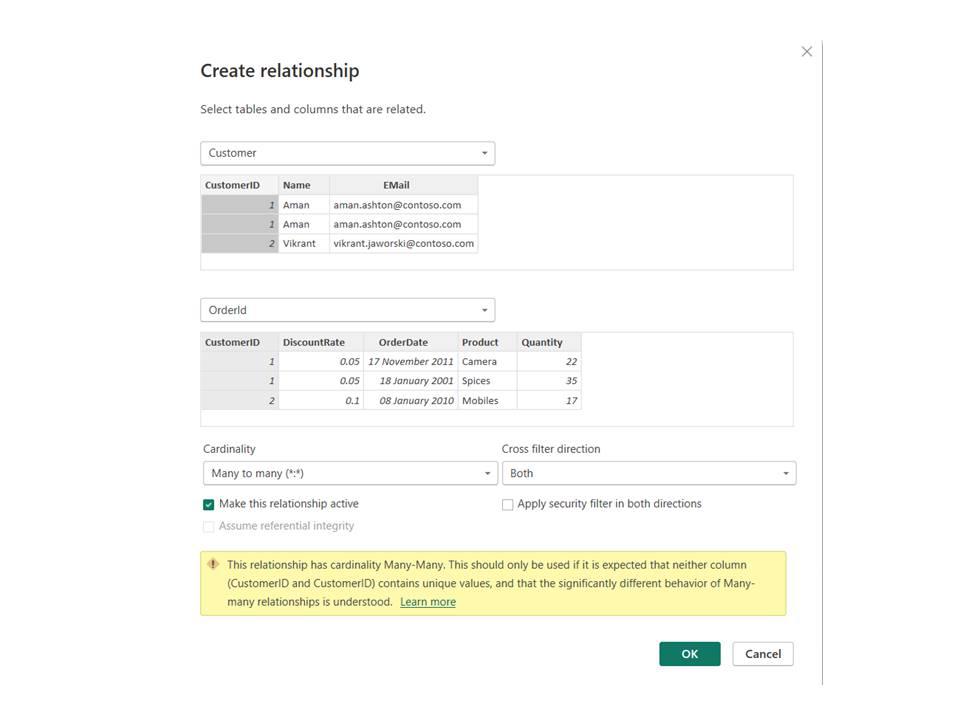
It shows the Relationship between the two table is Many to Many relationships means the record in the table can have many records in the other table or in associated table.
Many to Many Relationship
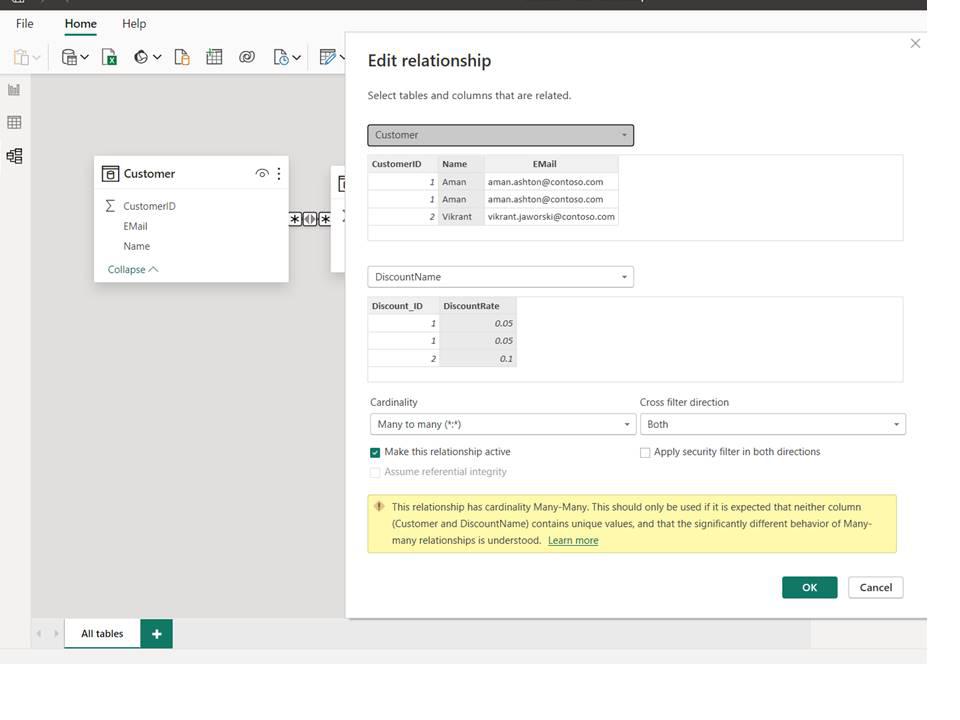
CustomerID and Discount_Id columns are same.
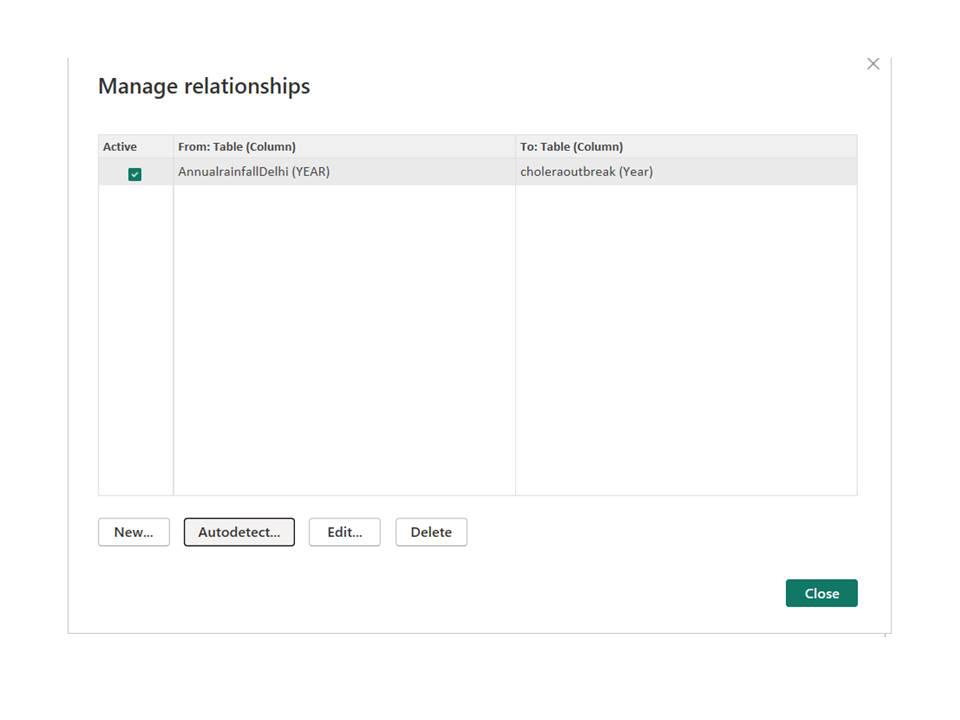
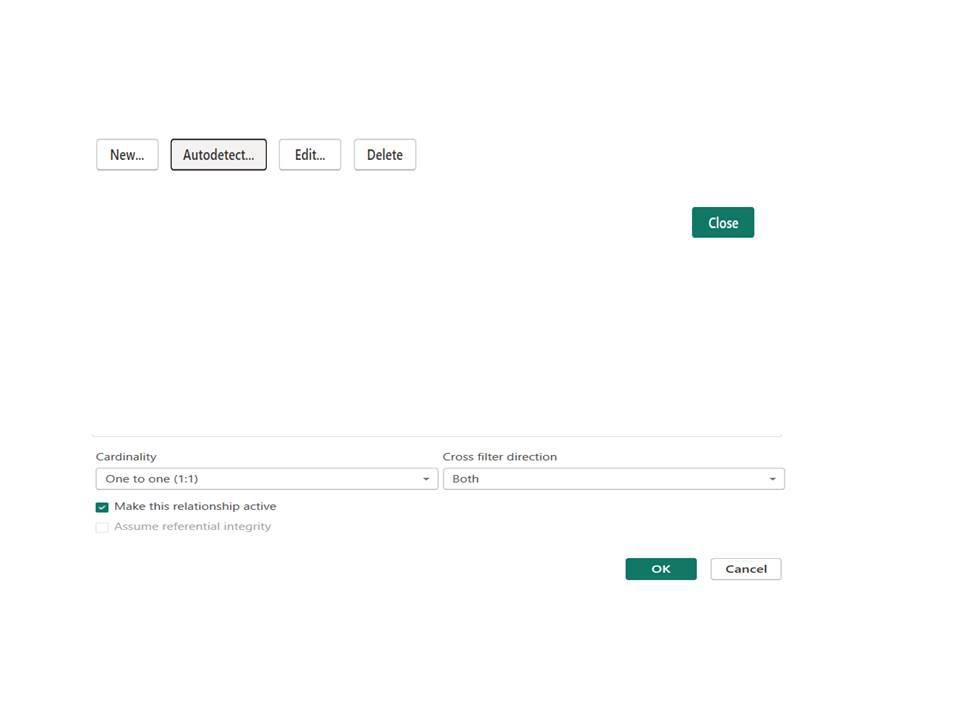
Generally, Power Bi catch the relationship automatically. You can create new by clicking the Modeling tab on the upper side, then choose the Manage Relationship tab. You can edit or create new too.
Manage Relationship
Relationship
One to One Relationship
One to One Relationship
Cardinality
It refers to the degree of relationship.
- One-to-One: This relationship occurs when the entity of one table is related to one entity of another table. An employee has been allotted a laptop to work within a organization. The laptop will be used by the employee only and thus an employee shared one to one relationship.
- One to Many: This type of relation exists when one entity of one table is related to many entities in another table. In Infosys company many employees work in a particular department. The relations the department holds with the employee is one to many.
- Many to Many: This relation exists when many entities are related to many entities of another table.
Creating a new relationship
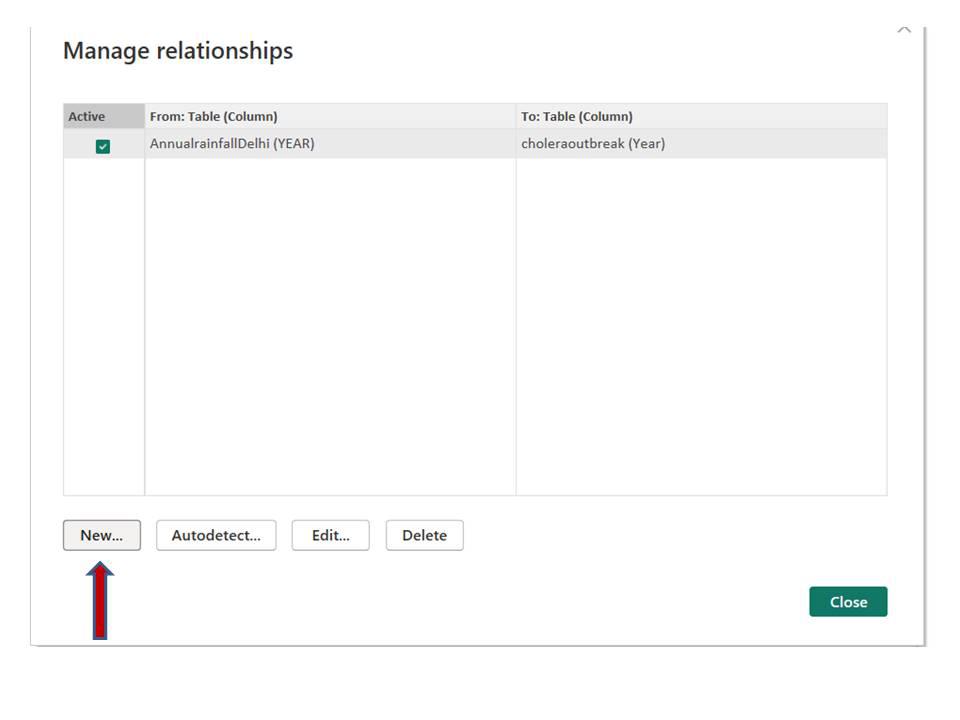
- Open the data model.
- Click on Modeling and Mange Relationship tab.
- Create a new relationship with New tab.
- Select the columns of the table and save the relationship by pressing the OK button.
Manage Relationship
New Relationship
Create a Relationship
Modifying the existing Relationship
- Open the data model.
- Click on the modeling and then Manage Relationship tab.
- Click on the Edit button.
- Change the Cardinality degree.
- Press the OK button.
Edit the Relationship
Optimizing the Performance
- Limiting the number by eliminating the unnecessary tables.
- Testing and Troubleshooting the model.
- Understanding the role of Cardinality impact and using it wisely.
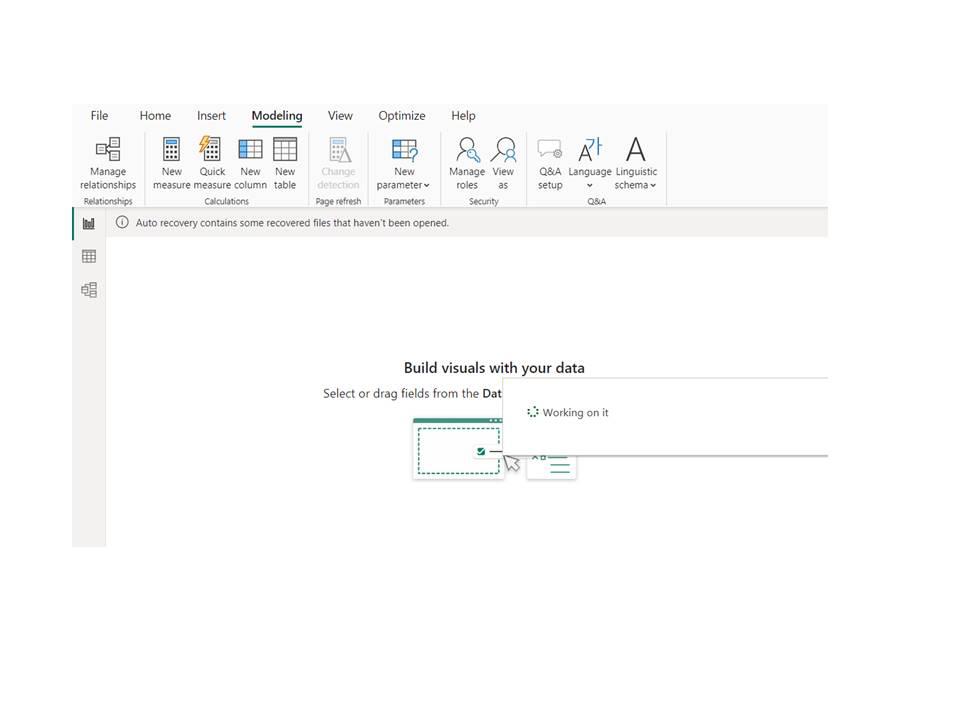
Creating a New Table
Like other Power BI Work area tables, determined tables can have associations with different tables.
Click on Modeling and go to tab New Table
New Table
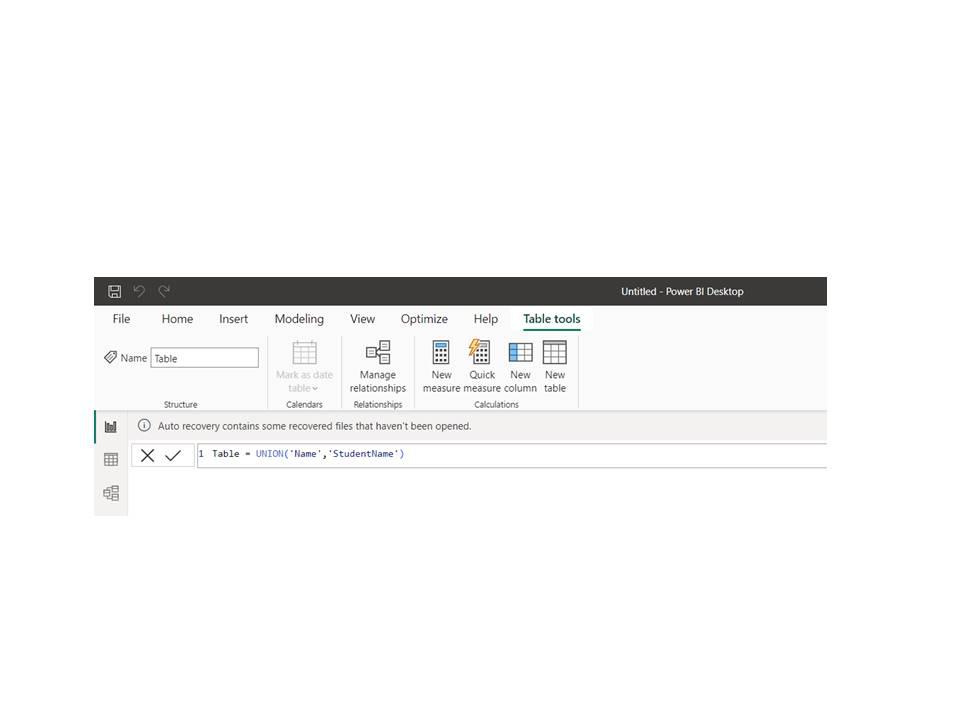
Write on the upper space Table name = UNION(‘Table1′,’Table2’). It will make a new table. Makes sure the table should have same name of columns.
You can use different functions that includes:
- NATURALINNERJOIN
- NATURALLEFTOUTERJOIN
- INTERSECT
- CALENDAR
- CALENDARAUTO
- DISTINCT
- VALUES
- CROSSJOIN
- UNION
We used the table of Student Name and Name that was already loaded and then we formed a new table with name Table.
Table = UNION ( ‘Name’, ‘StudentName’)
New Table
Conclusion
Various tools in Power BI can assist in acquiring refined reports and pursuing more educated choices. However, careful management of these relationships and performance optimization of your data model are essential. By following prescribed procedures, testing, and investigating consistently, one can expand the advantages of having numerous dynamic connections in Power BI and take your information examination to a higher level.
Share your thoughts in the comments
Please Login to comment...