Power BI Data Tables are like normal tables like Sales data tables with sales-related columns or information fields. It can have numeric values and quantitative values like total sales, loans taken, salary, and so on. They are also known as fact tables.
In this article, we will learn the basics of data tables further knowing their importance and basic features. It will also help in understanding the difference between Data Tables and Lookup Tables. The article will take you to the process of creating, importing, and managing data. Finally, we’ll show you how to customize and visualize data tables with others.
DataTables
The data table contains rows and columns of data used for easy analysis and visualization of reports or charts. Each row represents a single record whereas each column represents a field or attribute for that record in the row.
A very common example is item details like item code, item price, units sold, and so on. The look-up table will hold information like item names and other item-related descriptive information. Datatables are building blocks of reporting.
Benefits of using data tables in Power BI
There are several benefits to using data tables in Power BI:
- Efficient data storage: Data tables provide a structured way to store and organize large volumes of data. This ensures efficient data processing and analysis, even with complex datasets.
- Flexibility in analysis: Data tables allow users to perform various operations, such as filtering, sorting, and aggregating the data. This flexibility enables users to analyze the data from different angles and gain deeper insights.
- Custom calculations: Data tables enable users to create custom calculations and measures using the DAX (Data Analysis Expressions) language. This allows for advanced data manipulation and analysis, such as calculating growth rates, performing trend analysis, or creating weighted averages.
- Integration with visualizations: Data tables seamlessly integrate with Power BI’s visualization tools, allowing users to create interactive and visually appealing reports and dashboards. Users can easily link data tables with visual elements like charts, graphs, and tables to present data in a meaningful way.
Overall, data tables provide a solid foundation for data analysis and reporting in Power BI, enabling users to make data-driven decisions and uncover valuable insights.
Lookup Tables
Lookup tables are the tables that give detailed text-based information like the address, city, zip code, etc of any sales customer. The lookup tables do not contain numeric values, they are just used as reference tables holding detailed information at a granular for any id or key column. The key column is used to connect to the lookup table. It is the fundamental part of any data model or table design and serves as user-defined filtering tables effectively speeding up calculations in Power BI. Filters usually flow down from lookup tables to the main data tables.
Note: Lookup tables are used to easily build relationships with actual data tables.
Exploring the functionality of lookup tables in Power BI
Lookup tables, also known as dimension tables, are an integral part of Power BI projects. They help establish relationships between different data tables, enabling users to slice and dice the data based on different dimensions. Here are some key functionalities of lookup tables in Power BI:
- Data relationships: Lookup tables are used to create relationships between different data tables. These relationships define how data in one table is related to data in another table. By establishing relationships, users can combine data from multiple tables and perform cross-table analysis.
- Data filtering and slicing: Lookup tables provide a way to filter and slice data based on specific dimensions. For example, if a lookup table contains information about product categories, users can filter the data to show only the sales data for a particular category. This allows for granular analysis and exploration of the data.
- Hierarchical data representation: Lookup tables can be used to represent hierarchical data structures, such as organizational hierarchies or product hierarchies. This enables users to drill down into the data and view it at different levels of granularity. For example, users can analyze sales data at the overall company level, then drill down to regional or individual store levels.
- Data enrichment: Lookup tables can be used to enrich data by adding additional attributes or dimensions. For example, a lookup table for customer data can include demographic information like age, gender, or location. This enriched data can then be used for deeper analysis and segmentation.
The functionality of lookup tables in Power BI enhances the flexibility and depth of analysis that can be achieved. By establishing relationships and utilizing lookup tables effectively, users can gain a deeper understanding of their data and uncover valuable insights.
Key benefits of Data tables and Lookup tables
- Data modelling is the key feature which helps in creating and managing relationships between difeerent data tables and data sources, the extra text based information are associated with the help of lookup tables.
- They identify the correlations and dependencies helping to manage complex data sets visualizations and reporting
- These allow for easy filter and sorting of data. Also helps in analyzing data trends and patterns effectively helping in taking business decisions.
DataTables vs Lookup Tables
While data tables and lookup tables serve distinct purposes in Power BI, it is important to understand their key differences. Here are some of the main differentiating factors:
|
Data is organized in structured format with rows and columns for easy analyzing and visualizations.
|
The data is associated with descriptive text based information which gives context to the data.
|
|
They are also known as fact tables with granular data helping to run calculations over them.
|
They are also known as control or dimension tables helping to speed up caluclations by saving datatables space.
|
|
The data are mostly collected from input logs.
|
The data are mostly user-defined ones.
|
|
They are mostly used for easy visualization in the form of charts or graphs.
|
They are mostly used for building relationships with actual data tables andgive meaning to them.
|
|
They mostly contain numeric or quantitative values based data with some ID or key columns.
|
They mostly contain non-numeric data giving context to numeric data.
|
|
This holds the main table with transactional data.
|
This holds the fundamental part of data model with user-defined filtering table.
|
Creating Data Tables and Lookup Tables
Relationships are essential for connecting data tables and lookup tables, allowing you to link transactional data with its corresponding contextual information. In Power BI, you can create relationships by dragging and dropping fields between tables.
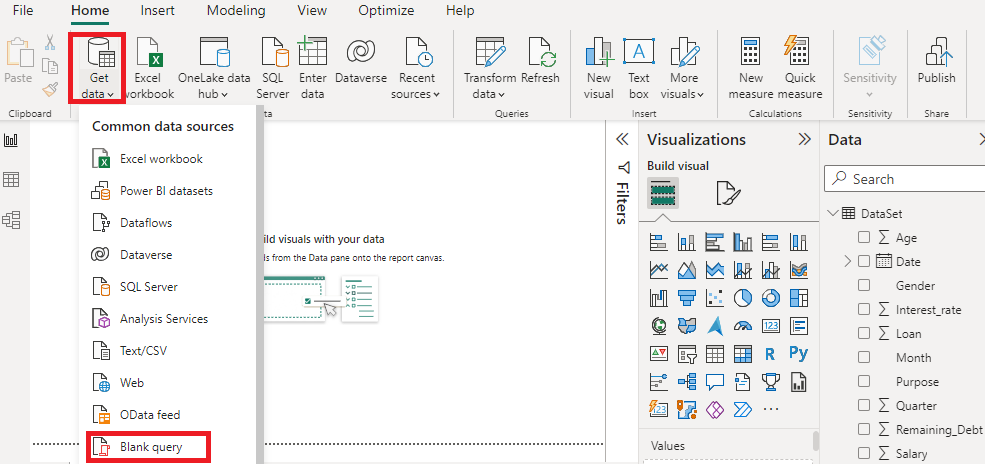
- Get data from the main “Home” screen.
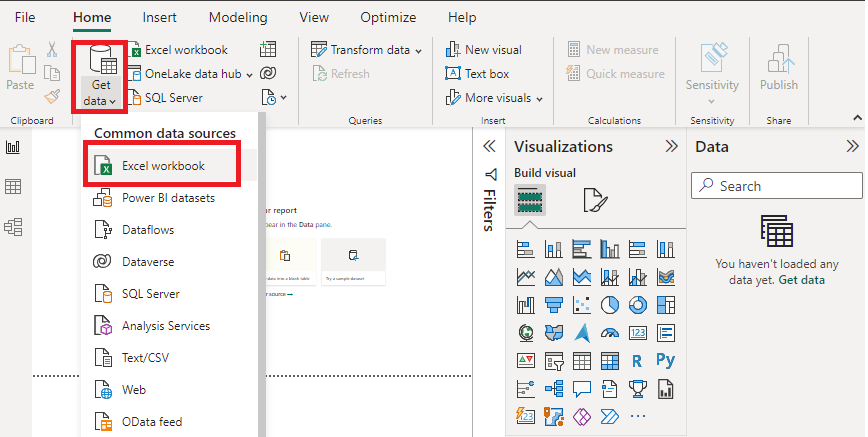
2. Choose the type of data source and location of your data. In the above image, the chosen data type is excel sheet, it can be any thing as per the user’s need.
3. After choosing the data source, the user can see the data table in the Power BI desktop.
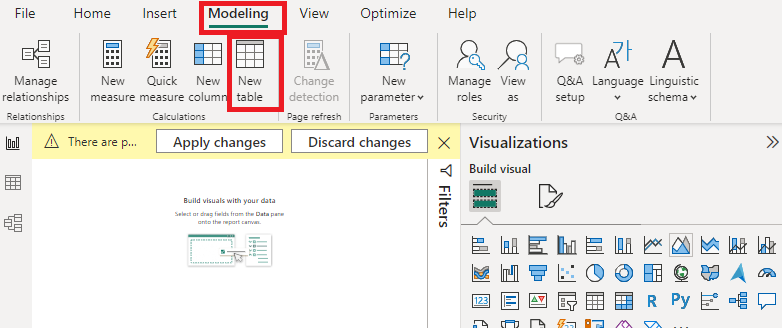
 3. Create new table from the “Modeling” tab in the top.
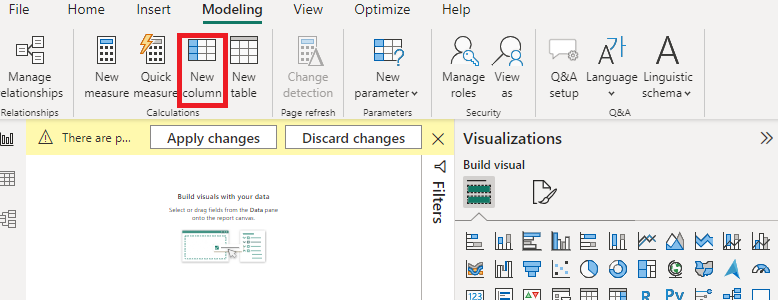
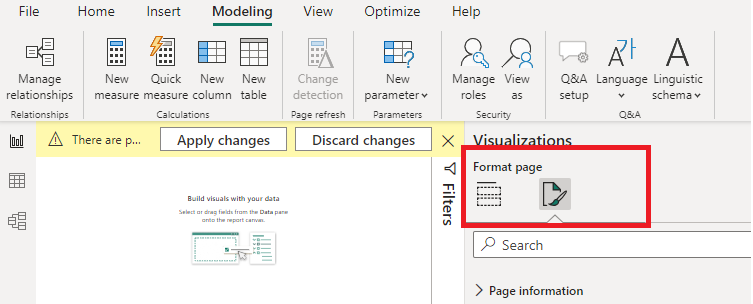
4. You can format the table by adding new columns , editing columns. Select the “Visualizations” pane, and then drag and drop the formated columns as per the requirement of visualization with appropriate fields. The user can customize the visualization by adjusting settings like colors, and data labels and others.
You can also add conditional columns also.
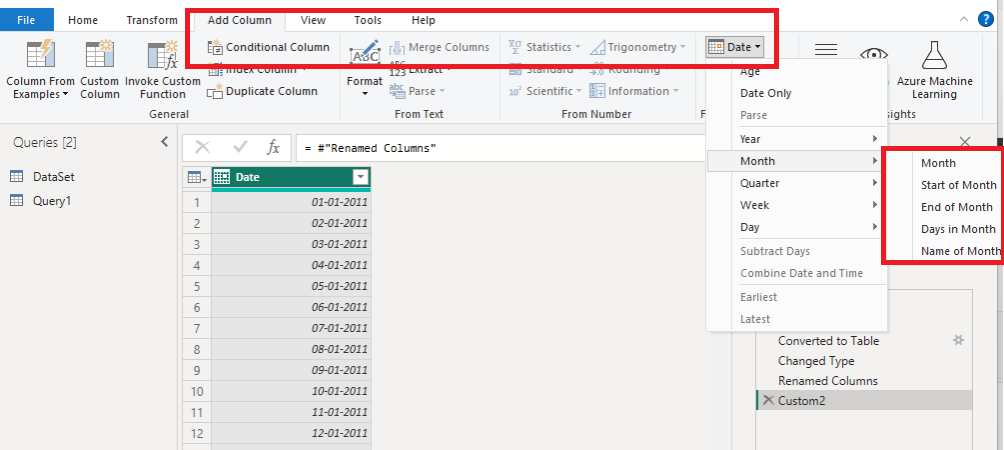
Other conditional formating includes sorting (both ascending and descending order), filtering which apply filters to your data table, grouping and aggregating your data using “Group By” functions from “Modelling” tab.Even the DAX functions can be used to enhance your already existing data.
-(1)______________________________.png)
5. Format the look and feel of tables.
Play around with other features with needed requirements.
6. Power BI also provides the power query editor which helps in manipulating and changing your data. You can add new columns, modify existing ones and save them so that the changes are applied on your datatables.
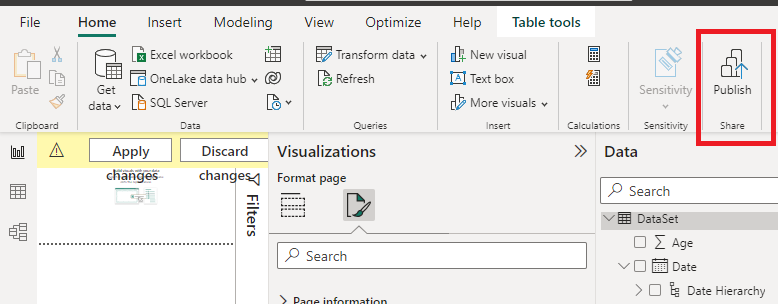
7. Share your data table in the desktop. This feature helps in publishing your report to the Power BI service.
How to create and manage tables in Power BI
Power BI also allows to create and manage datatable relationships.
Example 1
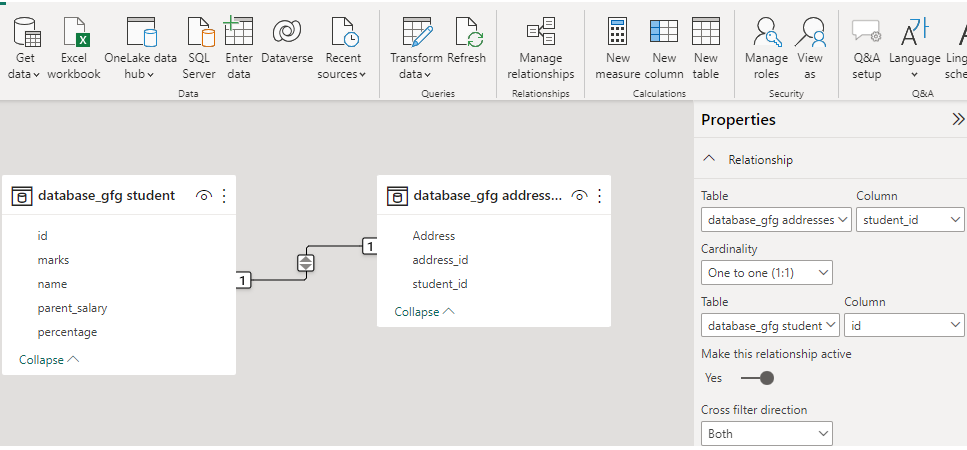
Consider the following relationship in Power BI desktop.
The “addresses” table is the main Data Table which has a one-to-one relationship with the “student” table. Here “student” table acts as a Lookup table holding all information regarding any student.
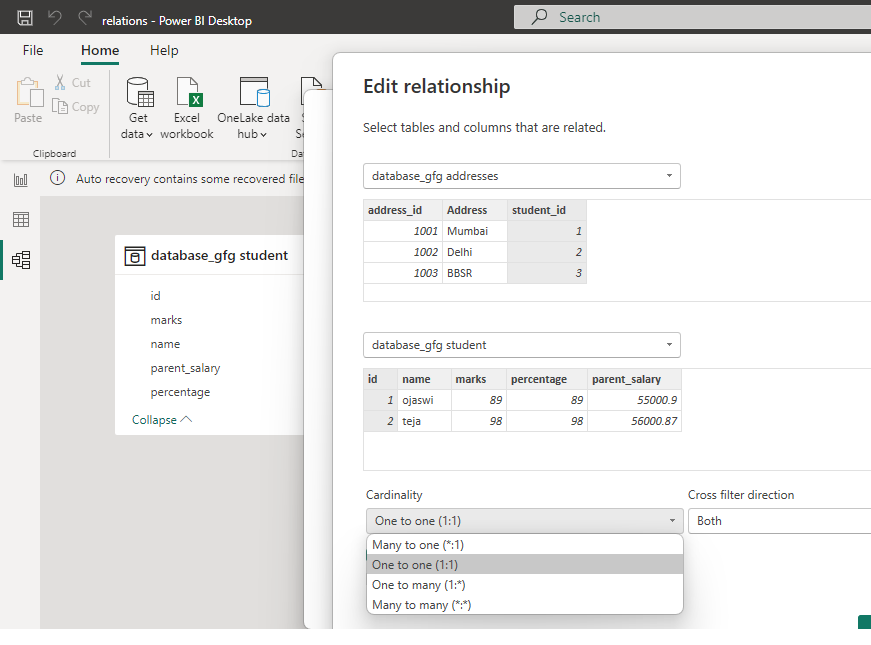
The key “student_id” from “addresses” table is linked to the “student” table.
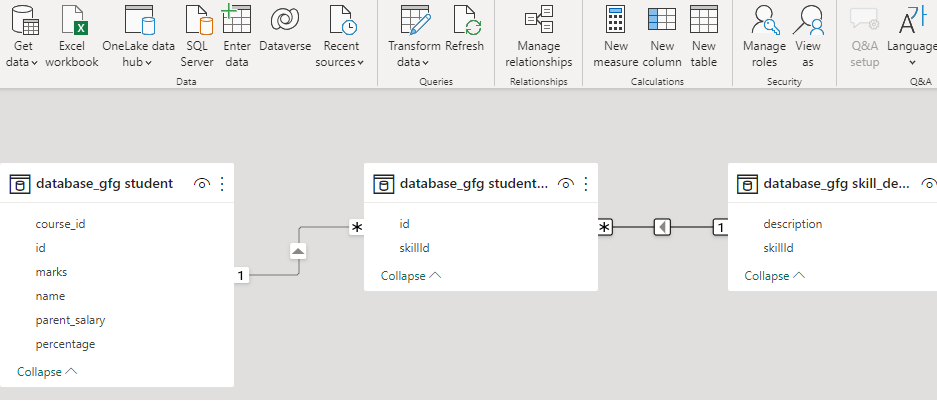
Example 2
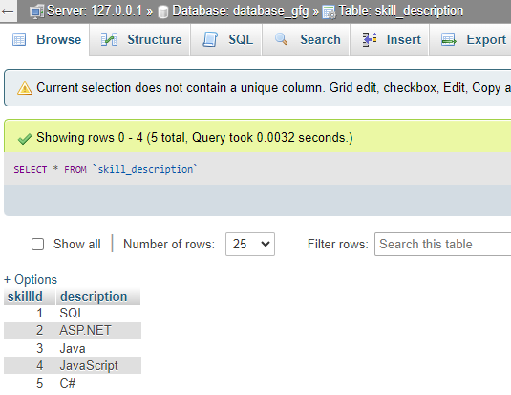
Consider another Power BI relationship as shown below. In this case, “student” table is the main Data table and “skill_description” is the lookup table which gives detailed information for any particular skill. ( skillId is the key used for the reference to skill_description table)
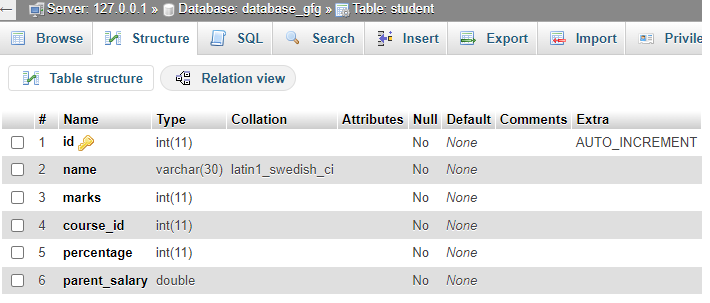
Data table: The following shows the main data table “student” with many columns as keys and also have quantitative columns values like “percentage”, “parent_salary” ,”marks”.
student_skill:
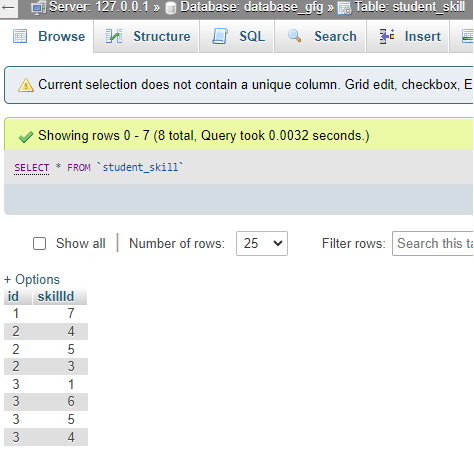
Skill description table: The following screenshot helps in understanding lookup tables as this holds information for any skill id as shown below. The “skillid” with value 1 is “SQL”, 2 is “ASP.NET” and so on.
Conclusion
Data tables are standard dimension tables and lookup tables helps in mapping key columns to detailed information. Data tables and lookup tables are fundamental components of data modeling in Power BI. Understanding their distinct roles and effectively implementing them is crucial for building robust, efficient, and scalable data models that support comprehensive data analysis and informed decision-making.
Share your thoughts in the comments
Please Login to comment...