In today’s world, “data is the new oil”. Data modeling is the process of creating visual representations of multiple tables or dataset connections. These datasets have attributes and fields with relevant information.
A data model is an organized visual representation of different data elements, their interconnections, and their relation with business needs or events. It helps in extracting data, transforming the data, and loading the data in the form of visuals which helps in making important business decisions.
- Power BI is a simple interface or software analysis tool that helps in showing conceptual representation of data elements. It is the logical model of data structuring with properties, attributes, and relationships. It is a tool for data analytics and visual representation for reporting. It has many features like editing and managing relationships, extracting data from multiple data sources, loading data, and representing reports with relevant insights based on the data fields. It is similar to the ER diagram used in database design.
- Power BI data models help businesses explore data using data-driven analysis that helps in identifying data patterns to get important conclusions or insights for improving business decisions. It is an AI-incorporated tool.
- Microsoft Power BI Data Model creates a visual representation of data after it is captured, stored, and analyzed clarifying your data requirements. To combine data from many sources, business intelligence solutions implement the Extract, Transform, and Load (ETL) method for the data. It can accept input from Excel sheets, databases, or even cloud storage.
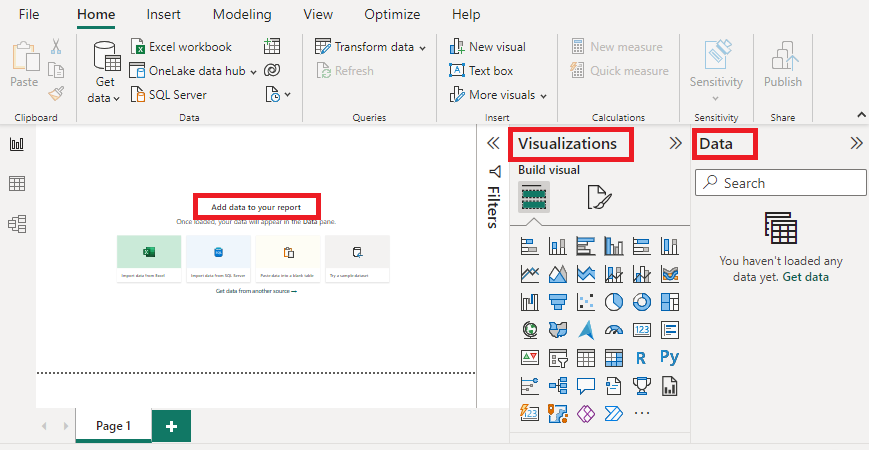
Power BI workspace: Power BI Workspace is a folder, where all your workbooks, datasets, reports, and dashboards are stored. This is the very initial look of the workspace once the user opens up the Microsoft Power BI desktop.
.png)
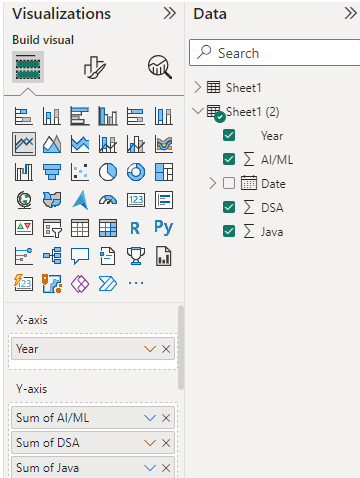
The user can see different panes in the Power BI dashboards with Report, Visualizations and Data panes. Report pane in the Left hand side is for showing reports based on the data fields selected from the Data pane in the right hand side. Visualizations pane helps to select the type of chart used for showing the report. The different visuals are shown with the help of Pie, column, slicer, bar charts and many more.
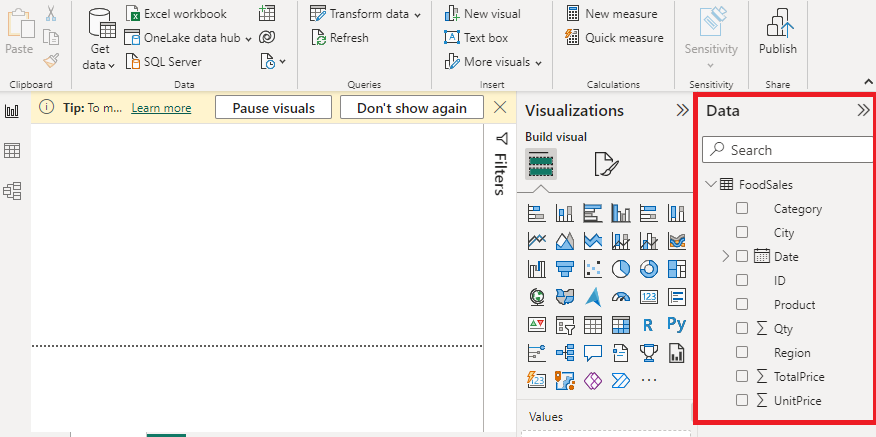
The following image shows one simple example of Data Pane section in the right hand side, once the data source from excel file is loaded in the Power BI desktop.
Different components of Power BI: The dashboard in Power BI is a single page that shows all data and visualization of reports, and datasets in a specific structured way. Power BI set a relationship between 2 objects, view the relationship in a data model.
Power BI provides facility to extract data from one or many data sources. It also It helps in grouping and filtering data for detailed analysis.
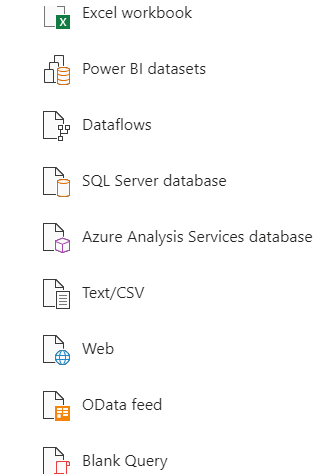
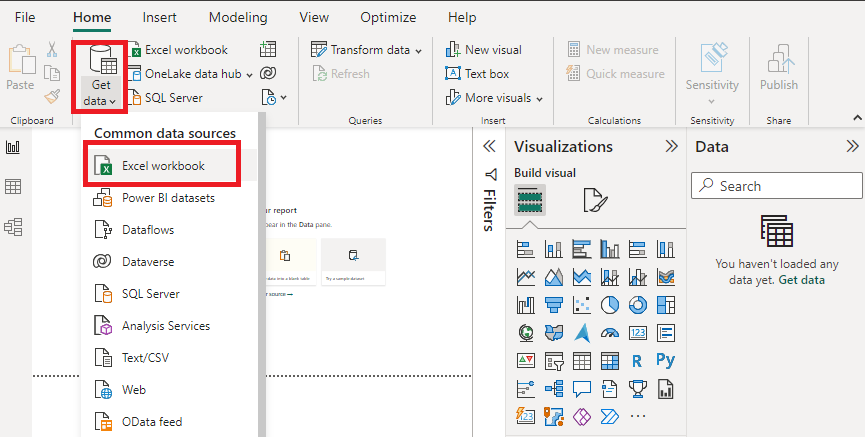
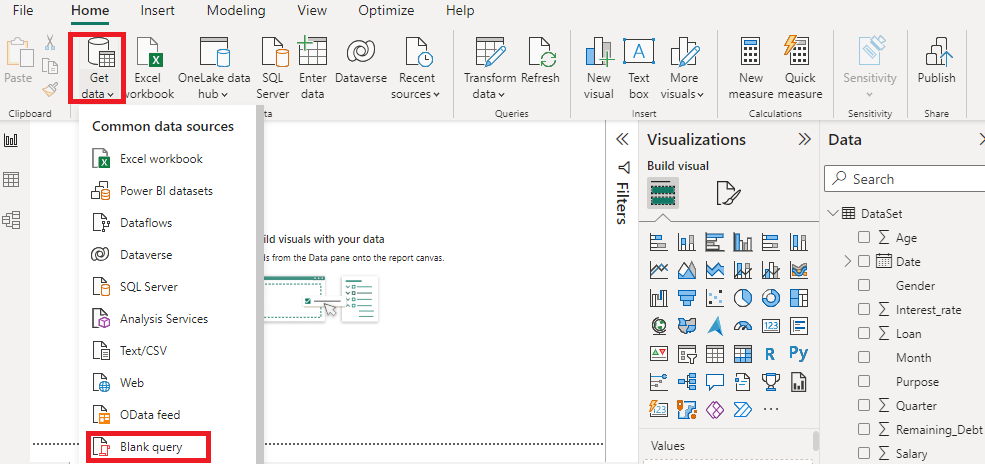
Data can be imported from cloud based online sources and files in your system. The different type of data are excel, text/csv, XML, JSON, oracle database, Azure SQL databases and many more . The following image shows the list displayed when the user wants to select his data source type for extraction.
Power BI Data model features:
- Load, Retrieve, Analyze, visual representation, sort queries,optimise storage options.
Get data from data sources using Power BI: As shown in the above image, the data can be extracted from one or many data sources like CSV files, excel sheets, datasets, databases or cloud online sources. Power BI supports all these at a time which makes it a reliable tool to handle data analytics and reporting easily resulting in robust Data Models. The user can select one of the data source as per the need and availability.
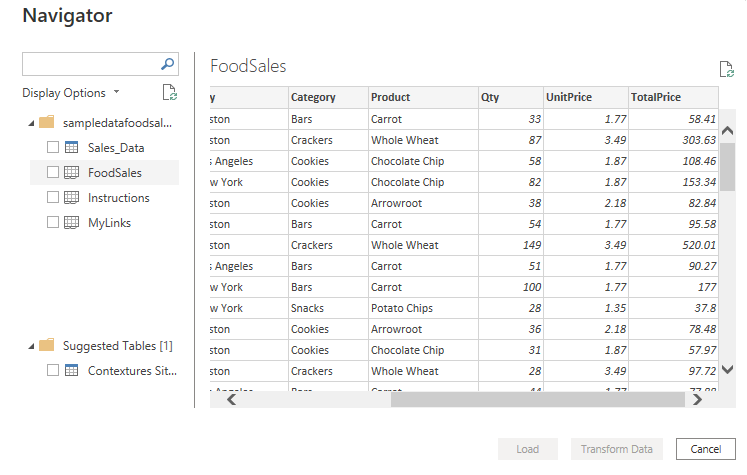
Navigator: Once the data source (Excel in this case) is selected by the user, the navigator helps in transforming the data sheet and load it for further process as shown below.
Note: We have taken random images to explain the concept , the user can try any dataset for practice and can play around with other features in the dashboard.
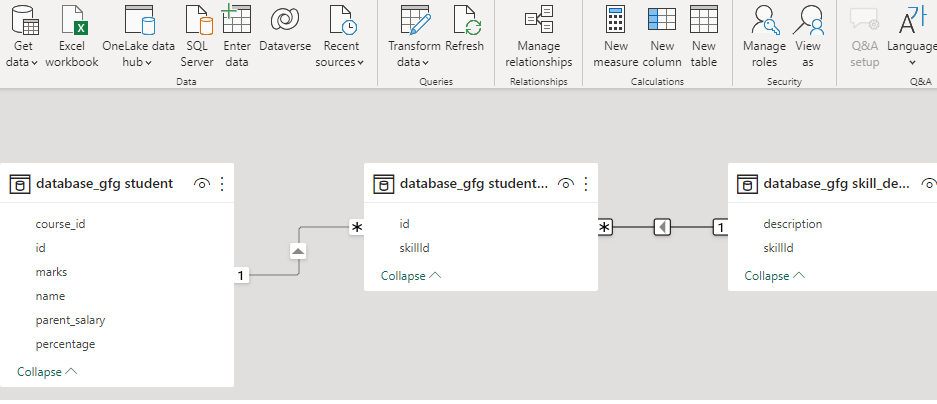
- Connect multiple data sources in BI tool using a relationship. Relationships are the main feature of data modelling defining all data types . Relationships helps connect with multiple data sources using Cardinality.
- The following image shows that we have different panes for Data, Properties, Visualizations and Reports.
- Understanding and clarifying your data requirement: Define data type, explain the usage of data, manage data, define data needs, remove redundant data ( data integrity ), retrieve data and perform data analytics (BI ), track key performance indicators and provide useful solutions for business.
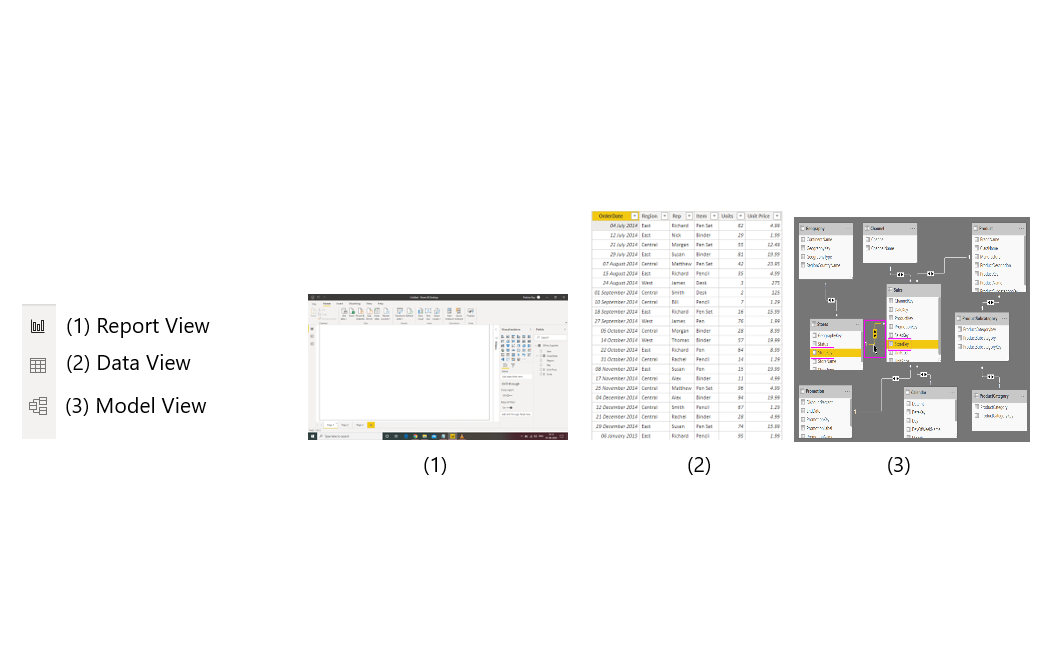
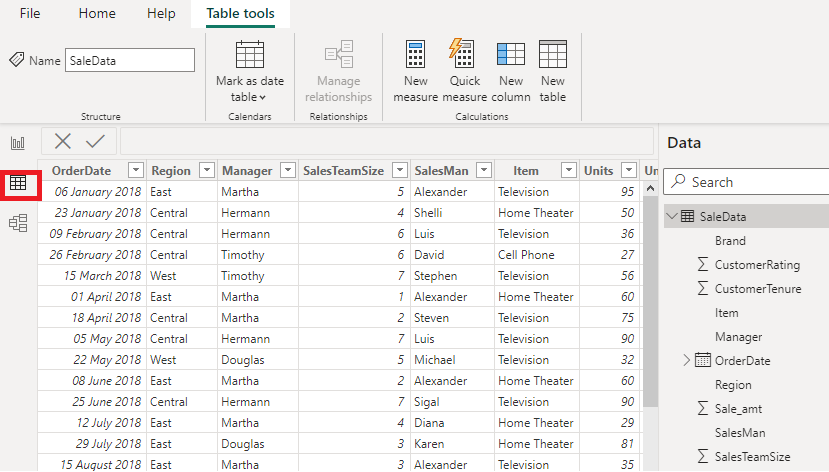
Data view in Power BI: Let us understand the data view of the Power BI desktop. The excel sheet file selected by the user is opened in data view which looks like the following image.
- Relationship between data attributes with in your data model helps in creating insights for story telling needs. Using relationships, we used to access data from other data sources.
Note: For creating table relationships please refer to the article “Creating Table Relationships in Power BI Desktop“
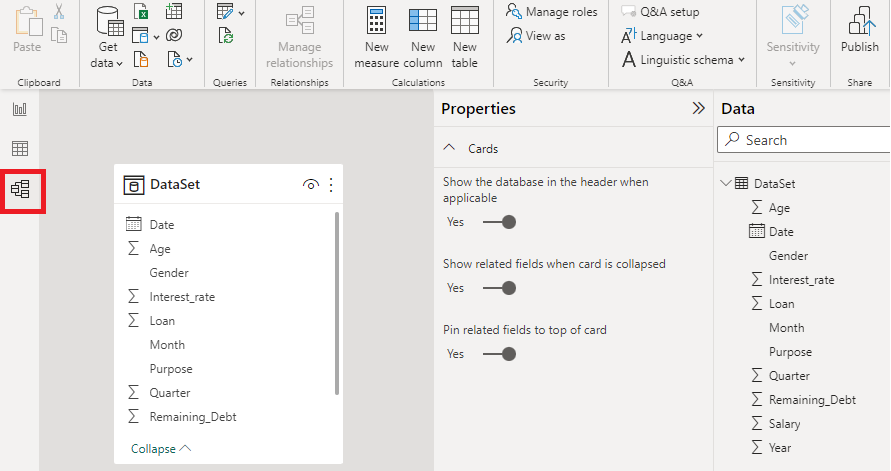
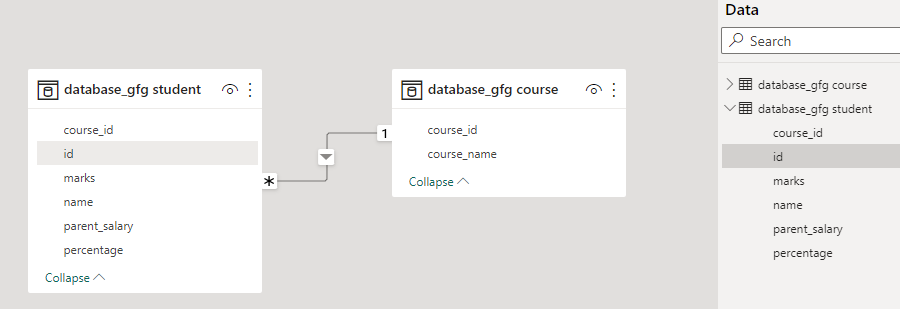
Model View in Power BI: It is the Data pane and its attributes to be taken into consideration for Report generation. The following image shows the Model view of any dataset selected by the user.
Report View: The following image shows the Report view with filter options for detailed reporting with other features like drill down, cross reports and others. The Report can have have many parameters which the user can choose for the analysis. The choice is made out of the requirement analysis or user’s need.
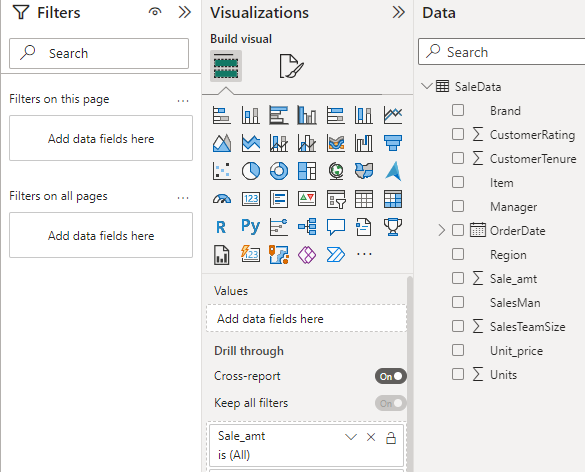
Filter options: Other options are provided for the detailed reporting. The following image shows the “Filters” pane of the Power BI desktop.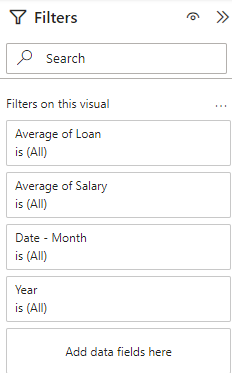
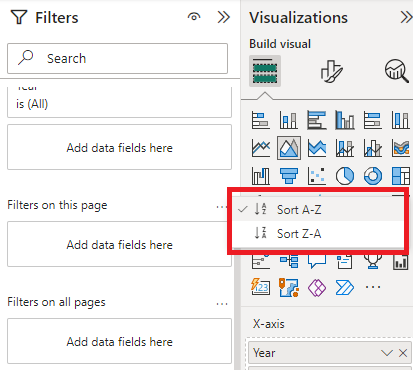
Sorting: The search and sort filters are set by the user as per the need of reporting in a particular order.
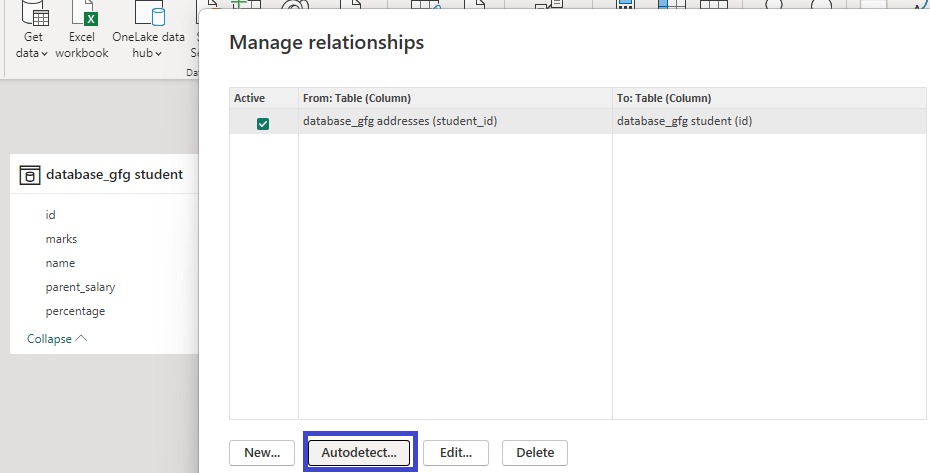
Power BI autodetect feature: If after loading all the tables, still no relationship can be seen between tables, then the Autodetect tool can be used to detect any relationship or connection.
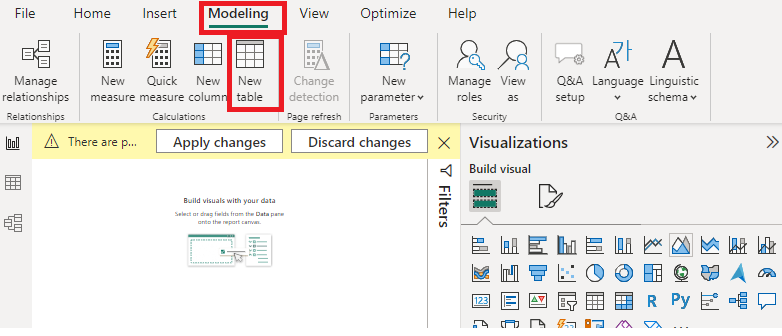
Modelling Feature in Power BI: There is also an option of creating and modelling relationships between table manually.
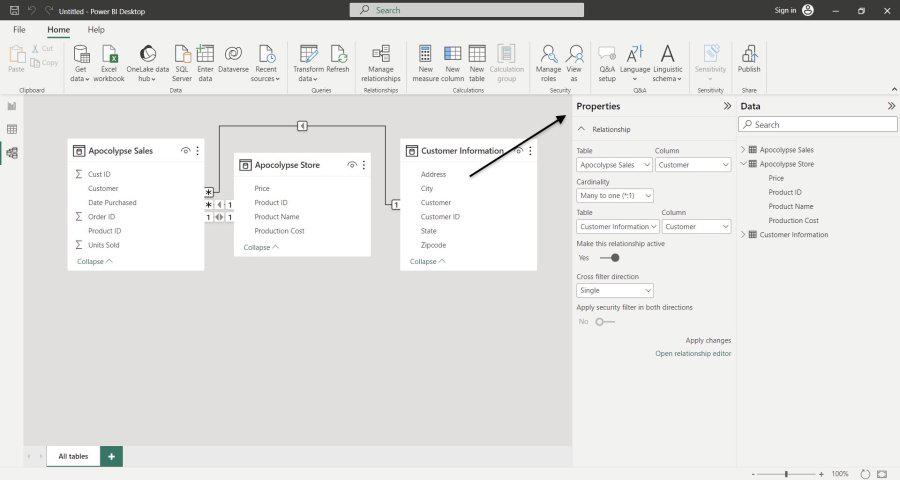
Create relationships in Power BI: Managing and editing table relationships refers to the process of defining and maintaining the connections between tables in a relational database. Table relationships are important for maintaining data integrity and ensuring efficient data retrieval.
The following image is just an example showing the editing of relationship between tables and its support for cardinality. The above link explains the cardinality in detail.
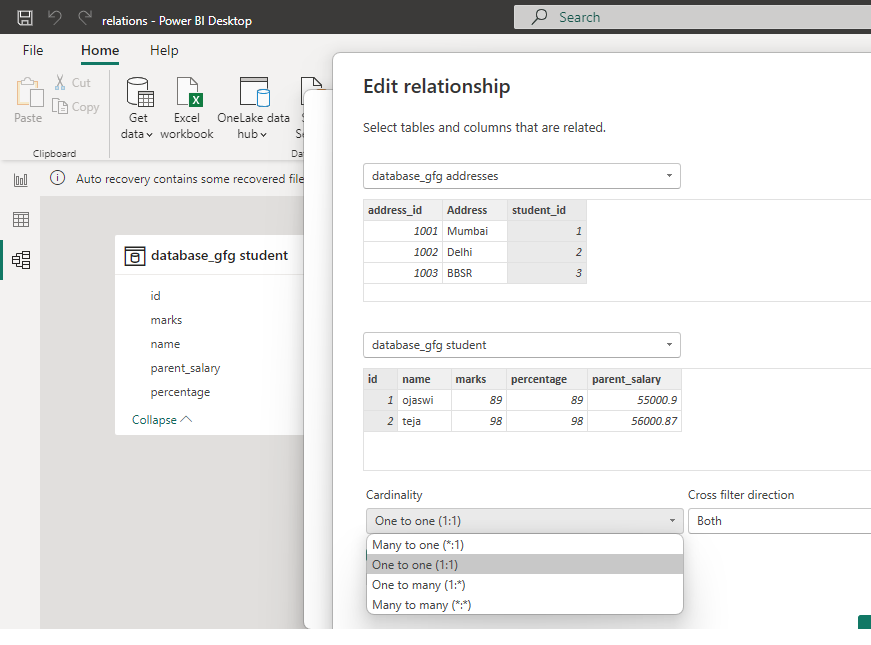
1.Many to one: This means that the column in a given table can have more than one instance of a value while the other table will only have one instance of the value.
2.One to one: This means that the column in one table has only one instance of value and the other table also has one instance of value.
3. One to many: In one-to-many relationship, the column in the given table has one instance of value while as the other related table can have more than one instance of value.
4. Many to many: This type of relationship is when a column in both tables has duplicate values.
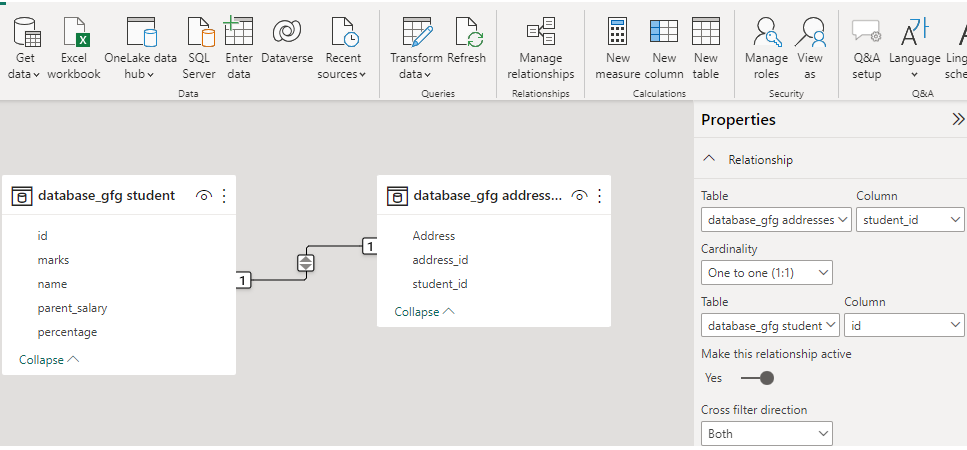
Cross filter direction: Power BI also supports directionality. This option determines the direction of cross-filtering to be utilized for a two-column relation. The details are given in the article link
DAX is set of instructions used to calculate data from tables. DAX is a formula and query language that is designed to work with tabular data models and is primarily used to simplify data analysis and calculation tasks in Power BI.
Other options or features of Power BI:
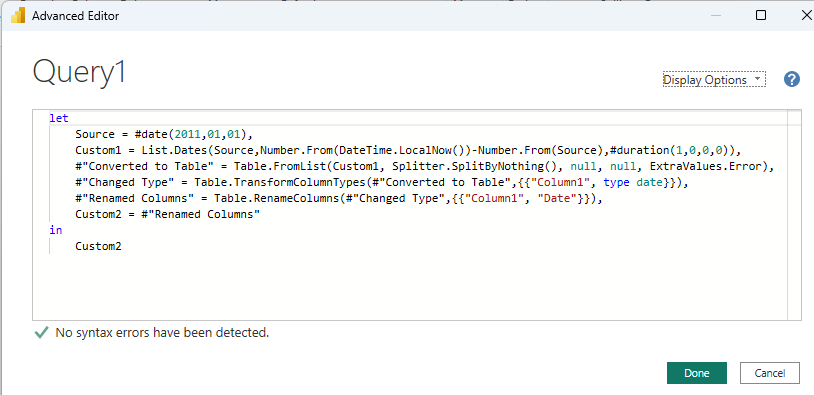
Advanced query: Query Editor in Power BI is used to edit or format the data files before they are loaded into the Power BI Model. The Query Editor plays the role of an intermediate data container where you can modify data type or the way the data is stored by selecting the particular rows and columns.
Data Model advantages
- It supports data exploration which helps in quick navigation.
- Speed up data visualization and report generation.
- Traversing through data is easy by avoiding unwanted columns and helps to get data trends.
- Easy to maintain and made accessible to all types of users.
- Easy to build data aggregation and very efficient for data retrieval.
- Automatic detect of relationships saves a lot of time and energy.
- It affects performance and promotes more accurate reports.
- Maintains data integrity by reducing data redundancy.
- DAX query helps in speedy and efficient data driven decision making
Features to look in a good data modelling tool
- Speed, efficiency
- Data retrieval, analysis, load should be handy.
- Easy update and maintenance and easy to use for all types of users.
Conclusion
Automated analytics tool like Power BI plays a vital role in business and helps to monitor bulk data. Power BI is a business intelligence and analytical tool to efficiently analyze and visualize large amounts of data and display a report. We have learned data modelling, its uses, and its efficiency in displaying the desired results in Power BI. With the help of Power BI and DAX Expression, we can calculate our desired data and visualize it in a better way. Power BI is an efficient business analytics tool when used effectively.
FAQs on Data Modelling
What are the features that should be included to make BI insights available to entire team?
Data Visualization, Shared Dashboards, Artificial intelligence and Machine learning
What are the common uses of using data models in BI?
Shared dashboards helps in reviewing historical data, forecast trends and assess risks to infer or understand company’s financial health. Helps in organizing, cleaning and process massive sequence of data effectively increasing productivity.
What are the real applications of Power BI data modelling?
Visualizations are provided in detailed manner. key data points from different tables are shown in single instance in a common or shared dashboard. Easy to monitor user activity or sale analysis. It helps to improve marketing campaign. It provides consistent reporting .
What is the default relationship in power BI ?
Many to one
Share your thoughts in the comments
Please Login to comment...