Compute the Value of F Density in R Programming – df() Function
Last Updated :
25 Jun, 2020
df() function in R Language is used to compute the density of F Distribution over a sequence of numeric values. It also plots a density graph for F Distribution.
Syntax: df(x, df1, df2)
Parameters:
x: Numeric Vector
df: Degree of Freedom
Example 1:
x <- seq(1, 30, by = 2)
y <- df(x, df1 = 2, df2 = 3)
y
|
Output:
 [1] 0.2788548009 0.0641500299 0.0255826045 0.0130822015 0.0077135607
 [6] 0.0049883063 0.0034419784 0.0024918293 0.0018719698 0.0014482499
[11] 0.0011475506 0.0009274979 0.0007622781 0.0006355006 0.0005363874
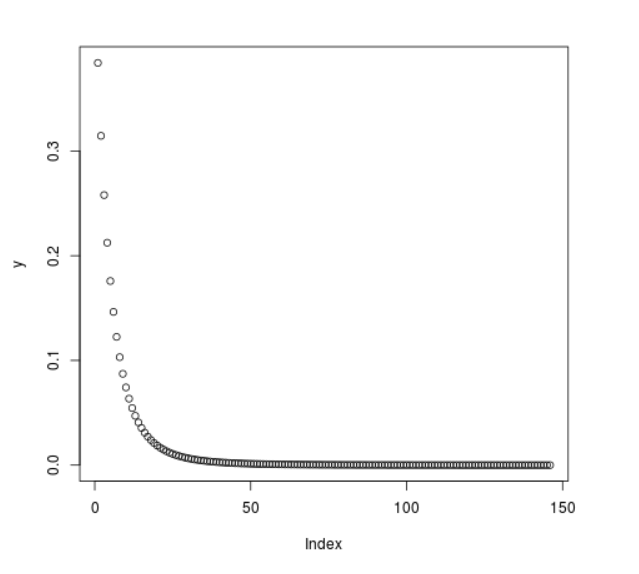
Example 2:
x <- seq(1, 30, by = 0.2)
y <- df(x, df1 = 3, df2 = 7)
plot(y)
|
Output:
Share your thoughts in the comments
Please Login to comment...