Order Bars in ggplot2 bar graph
Last Updated :
02 Feb, 2024
When creating bar graphs in ggplot2, it’s often crucial to control the order of bars on the x-axis based on a specific variable. This guide explores the theory behind ordering bars in ggplot2 bar graphs and provides various examples to illustrate different scenarios in the R Programming Language.
In ggplot2, the reorder() function is commonly used to reorder bars on the x-axis based on a specified variable. The reorder() function takes two arguments: the variable you want to reorder and the variable you want to use for ordering. It returns a factor with the levels reordered based on the values of the second argument.
R
data <- data.frame(
category = c("A", "B", "C", "D", "E"),
value = c(15, 8, 5, 12, 20)
)
|
Basic Bar Plot
In this example, we’ll create a basic bar plot without any specific ordering:
R
basic_plot <- ggplot(data, aes(x = category, y = value)) +
geom_bar(stat = "identity", fill = "skyblue") +
labs(title = "Basic Bar Plot")
print(basic_plot)
|
Output:

In this basic bar plot, the categories are plotted in the order they appear in the dataset.
Ordered Bar Plot
Now, let’s reorder the bars based on the value variable:
R
ordered_plot <- ggplot(data, aes(x = reorder(category, -value), y = value)) +
geom_bar(stat = "identity", fill = "skyblue") +
labs(title = "Ordered Bar Plot")
print(ordered_plot)
|
Output:
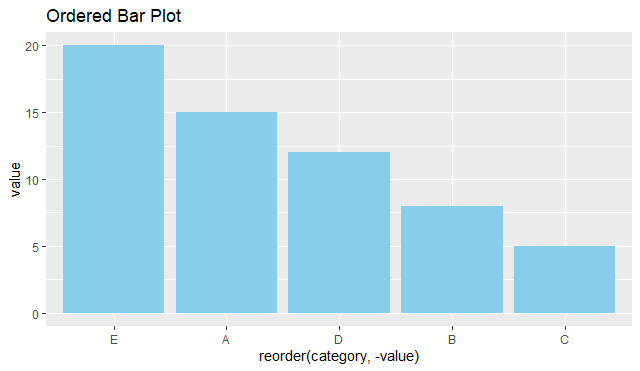
Here, the reorder(category, -value) function is used to reorder the bars on the x-axis based on the value variable in descending order. The resulting plot will have bars ordered from highest to lowest values.
Custom Ordering
You can also specify a custom order for the bars. In this example, let’s order the bars alphabetically:
R
custom_order_plot_ascending_values <- ggplot(data, aes(x = reorder(category, value,
FUN = function(x) sum(x)),
y = value)) +
geom_bar(stat = "identity", fill = "skyblue") +
labs(title = "Custom Ordered Bar Plot (Ascending by Values)")
print(custom_order_plot_ascending_values)
|
Output:
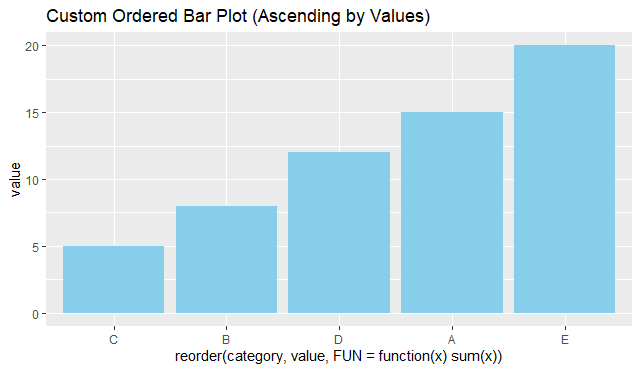
The reorder() function is adjusted to include the value variable, and a custom function is provided to reorder the categories in ascending order based on their values. The FUN argument now calculates the sum of the values for each category, ensuring ascending order by the total value.
Conclusion
Ordering bars in ggplot2 bar graphs is a valuable technique for enhancing the visual representation of your data. Whether you’re emphasizing certain categories or presenting data in a specific order, the reorder() function provides flexibility in achieving your desired bar order. Adapt these examples to suit your specific dataset and visualization goals.
Share your thoughts in the comments
Please Login to comment...