How To Change facet_wrap() Box Color in ggplot2 in R?
Last Updated :
19 Nov, 2021
In this article, we will discuss how to change facet_wrap() box color in ggplot2 in R Programming language.
Facet plots, where one subsets the data based on a categorical variable and makes a series of similar plots with the same scale. Facetting helps us to show the relationship between more than two categories of data. When you have multiple variables, with faceting it can be plotted in a single plot into smaller plots.
We can easily plot a facetted plot using the facet_wrap() function of the ggplot2 package. When we use facet_wrap() in ggplot2, by default it gives a title in a grey box.
Syntax: plot + facet_wrap( ~facet-variable)
Where:
facet-variable: determines the variable around which plots have to be divided.
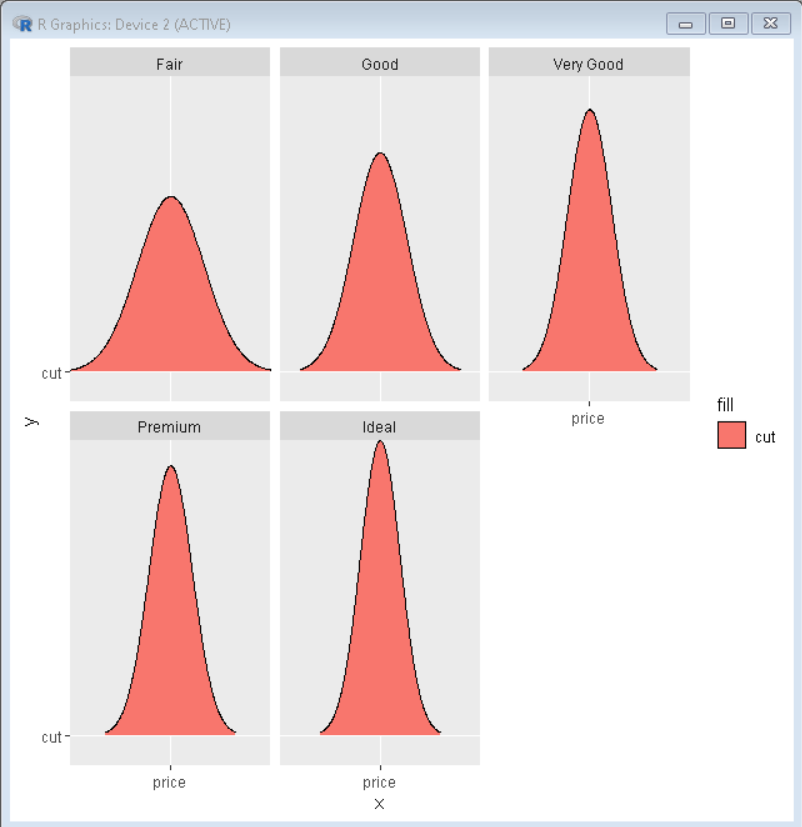
Creating a basic facet plot
Here, is a basic facet plot made using the diamonds data frame which is provided by R Language natively. We have used the facet_wrap() function with ~cut to divide the plot into facets according to their cut.
R
library(ggridges)
library(tidyverse)
ggplot(diamonds, aes(x="price", y="cut", fill="cut")) +
geom_density_ridges()+
facet_wrap(~cut)
|
Output:
Box Color Customization
We can customize various aspects of a ggplot2 using the theme() function. To change the default grey fill color in the facet_wrap() title box, we need to use “strip.background” argument inside the theme() layer with color and fill property of element_rect() function.
Syntax: plot + theme( strip.background = element_rect( colour, fill ))
Where:
- colour: determines the color of outline of box
- fill: determines the color of background fill of box
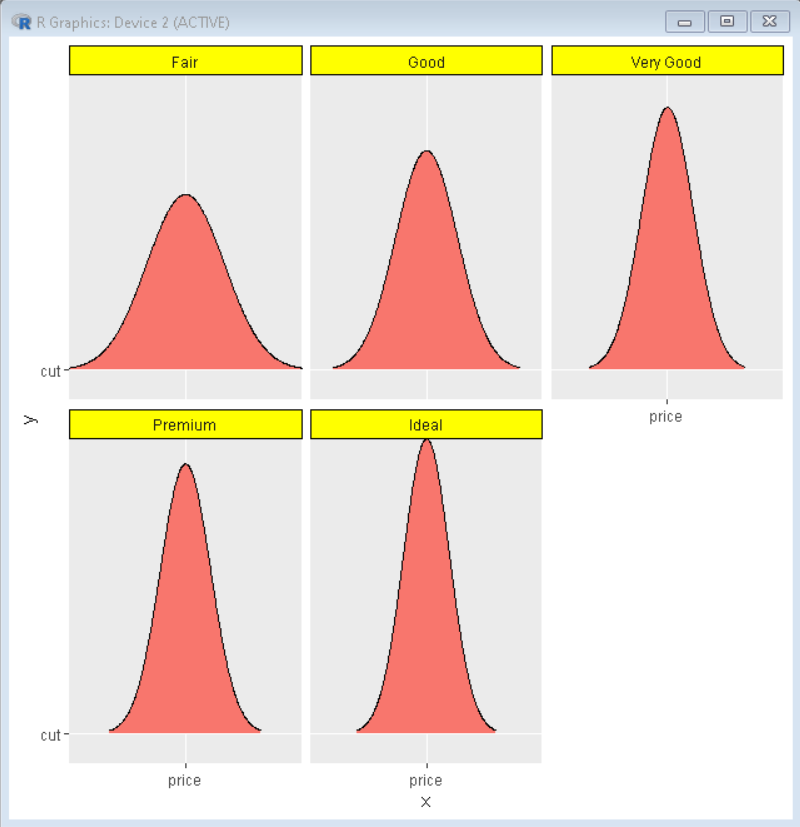
Example:
In this example, we specified element_rect with yellow fill color and black for box outline color.
R
library(ggridges)
library(tidyverse)
ggplot(diamonds, aes(x="price", y="cut", fill="cut")) +
geom_density_ridges()+
facet_wrap(~cut)+
theme(legend.position="none",
strip.background=element_rect(colour="black",
fill="yellow"))
|
Output:
Like Article
Suggest improvement
Share your thoughts in the comments
Please Login to comment...