Data analysis techniques have significantly evolved, providing a comprehensive toolkit for understanding, interpreting, and predicting data patterns. These methods are crucial in extracting actionable insights from data, enabling organizations to make informed decisions.
Data Analysis Techniques
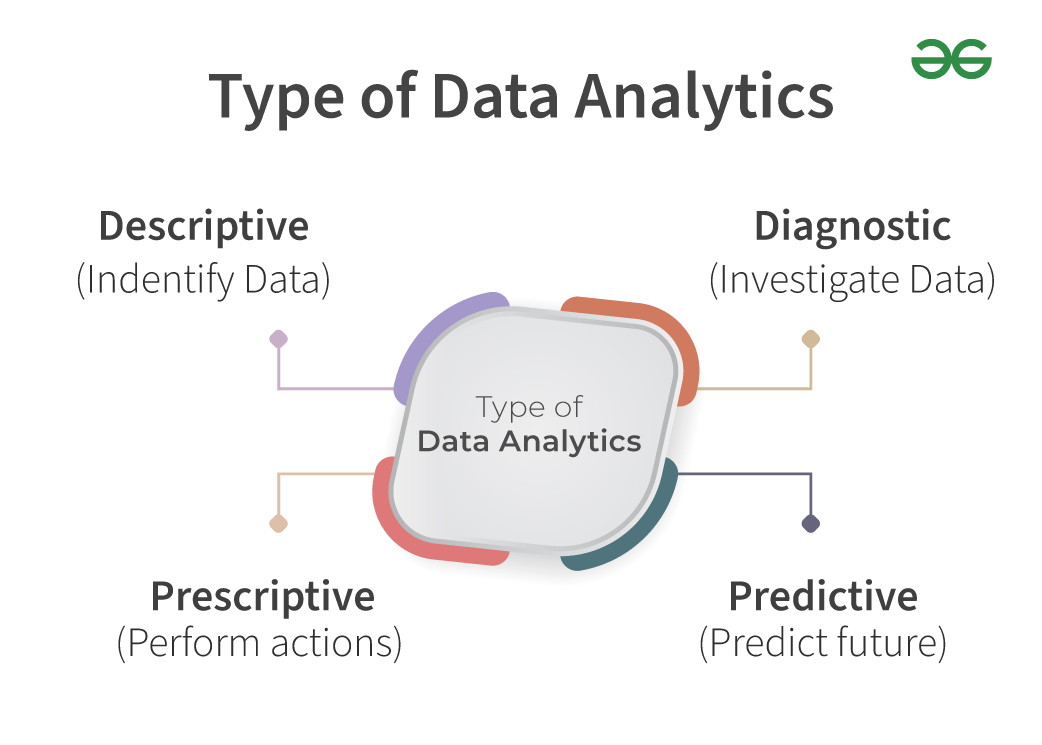
This article will cover major Types of Data Analysis Techniques, each tailored to specific goals and data types.
Descriptive Data Analysis
Descriptive analysis is considered the beginning point for the analytic journey and often strives to answer questions related to what happened. This technique follows ordering factors, manipulating and interpreting varied data from diverse sources, and then turning it into valuable insights.
In addition, conducting this analysis is imperative as it allows individuals to showcase insights in a streamlined method. This technique does not allow you to estimate future outcomes – such as identifying specific reasoning for a particular factor. It will keep your data streamlined and simplify to conduct a thorough evaluation for further circumstances.
Examples of Descriptive Data Analysis :
- Sales Performance: A retail company might use descriptive statistics to understand the average sales volume per store or to find which products are the best sellers.
- Customer Satisfaction Surveys: Analyzing survey data to find the most common responses or average scores.
Qualitative Data Analysis
Qualitative data analysis techniques cannot be measured directly, and hence, this technique is utilized when an organization needs to make decisions based on subjective interpretation. For instance, qualitative data can involve evaluating customer feedback, the impact of survey questions, the effectiveness of social media posts, analyzing specific changes or features of a product, and more.
The focus of this technique should be identifying meaningful insights or answers from unstructured data such as transcripts, vocal feedback, and more. Additionally, qualitative analysis aids in organizing data into themes or categories, which can be further automated. Quantitative data analysis refers to measurable information, which includes specific numbers and quantities. For instance, sales figures, email campaigns based on click-through rates, website visitors, employee performance percentage, or percentage for revenue generated, and more.
Examples of Qualitative Data Analysis:
- Market Analysis: A business might analyze why a product’s sales spiked in a particular quarter by looking at marketing activities, price changes, and market trends.
- Medical Diagnosis: Clinicians use diagnostic analysis to understand the cause of symptoms based on lab results and patient data.
Predictive Data Analysis
Predictive data analysis enables us to look into the future by answering questions—what will happen? Individuals need to utilize the results of descriptive data analysis, exploratory and diagnostic analysis techniques, and combine machine learning and artificial intelligence. Using this method, you can get an overview of future trends and identify potential issues and loopholes in your dataset.
In addition, you can discover and develop initiatives to enhance varied operation processes and your competitive edge with insightful data. With easy-to-understand insights, businesses can tap into trends, common patterns, or reasons for a specific event, making initiatives or decisions for further strategies easier.
Examples of Predictive Data Analysis:
- Credit Scoring: Financial institutions use predictive models to assess a customer’s likelihood of defaulting on a loan.
- Weather Forecasting: Meteorologists use predictive models to forecast weather conditions based on historical weather data.
Diagnostic Data Analysis
When you know why something happened, it is easy to identify the “How” for that specific aspect. For instance, with diagnostic analysis, you can identify why your sales results are declining and eventually explore the exact factors that led to this loss.
In addition, this technique offers actionable answers to your specific questions. It is also the most commonly preferred method in research for varied domains.
Example of Diagnostic Data Analysis:
- Inventory Analysis: Checking if lower sales correlate with stock outs or overstock situations.
- Promotion Effectiveness: Analyzing the impact of different promotional campaigns to see which failed to attract customers.
Regression Analysis
This method utilizes historical data to understand the impact on the dependent variable’s value when one or more independent variables tend to change or remain the same. In addition, determining each variable’s relationship and past development or initiative enables you to predict potential outcomes in the future. And the technique gives you the right path to make informed decisions effectively.
Let’s assume you conducted a Regression Analysis for your sales report in 2022, and the results represented variables like customer services, sales channels, marketing campaigns, and more that affected the overall results. Then, you can conduct another regression analysis to check if the variables changed over time or if new variables are impacting your sales result in 2023. By following this method, your sales can increase with improved product quality or services
Example of Regression Analysis:
- Market Trend Assessment: Evaluating how changes in the economic environment (e.g., interest rates) affect property prices.
- Predictive Pricing: Using historical data to predict future price trends based on current market dynamics.
Cohort Analysis
Cohort analysis includes historical data to analyze and compare specific segments in user behavior and groups a few aspects with other similar elements. This technique can provide an idea of your customer’s and target audience’s evolving needs.
In addition, you can utilize Cohort analysis to determine a marketing campaign’s impact on certain audience groups. For instance, you can implement the features of the Cohort analysis technique to evaluate two types of email campaigns—commonly termed A/B Testing over time—and understand which variation turned out to be responsive and impactful in terms of performance.
Example of Cohort Analysis:
- Customer Retention: Measuring how long newly acquired customers continue to make purchases compared to those not enrolled in the loyalty program.
- Program Impact: Determining if and how the loyalty program influences buying patterns and average spend per purchase.
Factor Analysis
Factor data analysis defines the variations with observed related variables based on lower unobserved variables termed factors. In short, it helps in extracting independent variables, which is considered ideal for optimizing specific segments.
For instance, if you have a product and collect customer feedback for varied purposes, this analysis technique aids in focusing on specific factors like current trends, layout, product performance, potential errors, and more. The factors can vary depending on what you want to monitor and focus on. Lastly, factor analysis simplifies summarizing related factors in similar groups.
Example of Factor Analysis :
- Service Improvement: Identifying key factors such as wait time, staff behavior, and treatment outcome that impact patient satisfaction.
- Resource Allocation: Using these insights to improve areas that significantly affect patient satisfaction.
Time Series Analysis
A time series analysis technique checks data points over a certain timeframe. You can utilize this method to monitor data within a certain time frame on a loop; however, this technique isn’t ideal for collecting data only in a specific time interval.
Sounds confusing? This technique is ideal for determining whether the variable changed amid the evaluation interval, how each variable is dependent, and how the result was achieved for a specific aspect. Additionally, you can rely on time series analysis to determine market trends and patterns over time. You can also use this method to forecast future events based on certain data insights.
Example of Time Series Analysis :
- Demand Forecasting: Estimating sales volume for the next season based on historical sales data during similar periods.
- Resource Planning: Adjusting production schedules and inventory levels to meet anticipated demand.
Cluster Analysis
Cluster analysis describes data and identifies common patterns. It is often used when data needs more evident labels or insights or has ambiguous categories. This process includes recognizing similar observations and grouping those aspects to create clusters, which means assigning names and categorizing groups.
In addition, this technique aids in identifying similarities and disparities in databases and presenting them in a visually organized method to seamlessly compare factors. Box plot visualization is mainly preferred to showcase data clusters.
Example of Cluster Analysis:
- Market Segmentation: Dividing customers into groups that exhibit similar behaviors and preferences for more targeted marketing.
- Campaign Customization: Designing unique marketing strategies for each cluster to maximize engagement and conversions.
Conclusion
Each method offers unique benefits and is suited to different types of data challenges. Understanding and applying the right data analysis techniques can significantly impact an organization’s strategy and decision-making processes, leading to more targeted, efficient, and effective outcomes.
Share your thoughts in the comments
Please Login to comment...