Swish Activation Function
Last Updated :
11 Oct, 2023
As the Machine Learning community keeps working on trying to identify complex patterns in the dataset for better results, Google proposed the Swish Activation function as an alternative to the popular ReLU activation function. The authors of the research paper show that using the Swish Activation function instead of ReLU improves the accuracy of the ImageNet dataset by 0.6% for Inception-ResNet-v2 architecture.
Sigmoid Activation Function
The Sigmoid activation function is a popular activation function that was used in almost all Machine Learning models and Neural Networks in the initial days, but with time, the problems with the Sigmoid activation function were discovered which led to its use being restricted to the output layer.
The mathematical formula for this activation function is:

Let us visualize the graph for the sigmoid function by Python Code implementation:
Python3
import matplotlib.pyplot as plt
import numpy as np
r_list = np.random.uniform(-10,10,100)
def sigmoid(x):
return 1/(1+np.exp(-x))
|
After we have imported the necessary files and created the necessary function, we will now plot the data points:
Python3
plt.plot(np.sort(r_list), sorted(sigmoid(np.sort(r_list))))
plt.xlabel('Values of x')
plt.ylabel('sigmoid(x)')
plt.title("Sigmoid Function")
plt.show()
plt.savefig('Sigmoid.png')
|
Output:
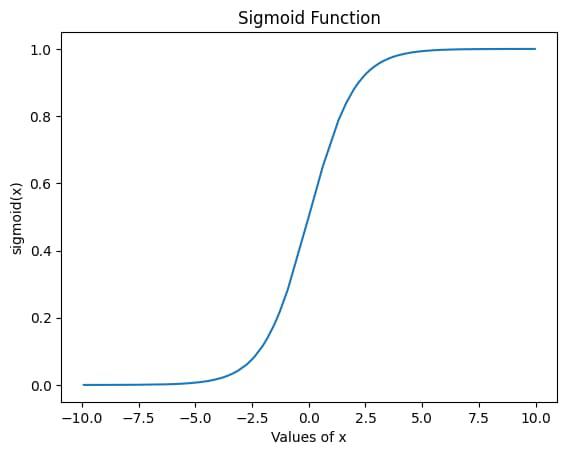
As you can see, the output for this function lies between 0 and 1, so this activation function is especially used in the models where we have to predict probability as an output.
Problem with Sigmoid Activation Function
The major problem with using this activation function is that the output of this function saturates for larger values of x, as can be seen from the graph. Due to this the gradients value starts decreasing on every iteration of training and finally it becomes so small that weights remain almost the same. This problem is also known as the Vanishing Gradient problem.
ReLU Activation Function
This function is the most common alternative to the Sigmoid activation function. The mathematical formula for this is:

This function solves the Gradient Vanishing problem encountered while using sigmoid activation function however it is only used in the hidden layers.
Code Implementation:
Python3
def relu(x):
return np.maximum(0, x)
plt.plot(np.sort(r_list), np.sort(relu(np.sort(r_list))))
plt.xlabel('Values of x')
plt.ylabel('Relu(x)')
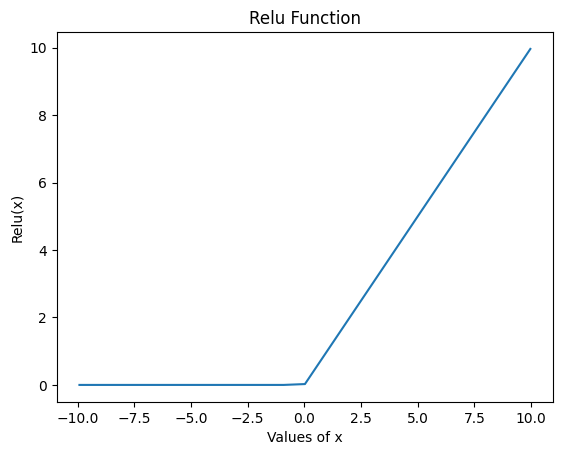
plt.title("Relu Function")
plt.show()
plt.savefig('Relu.png')
|
Output:
Problem with ReLU Activation Function
As you can see from the graph, the function outputs 0 for any negative value. This leads to the problem of “Dying ReLU” where the function outputs 0 for all the input values. The gradient then also becomes 0 leading because of which the weights do not get updated.
Swish Activation Function
The Swish activation function is a slight modification of the sigmoid function. The mathematical formula for this is:
 , where
  is a scalable and trainable parameter.
This function, unlike the ReLU function is not outputting 0 for all the negative values while it also maintains it’s characteristics for the positive values of x. The authors of the research paper show that using the Swish Activation function instead of ReLU improves the accuracy on ImageNet dataset by 0.6% for Inception-ResNet-v2 architecture.
Let us see the implementation of Swish function for various beta values:
Python3
def swish(x, b):
return x*sigmoid(b*x)
b_list = [0.1,0.2,0.5,1,1.5,2]
fig, ax = plt.subplots(3,2, figsize = (10,8))
ax = ax.ravel()
for i,b in enumerate(b_list):
ax[i].plot(np.sort(r_list), (swish(np.sort(r_list),b)))
ax[i].set_title(f'Swish function with b = {b}')
ax[i].set_xlabel('Values of x')
ax[i].set_ylabel('Swish function')
plt.tight_layout()
plt.show()
plt.savefig('Swish.png')
|
Output:

Here, we can see the variation the parameter brings into swish function. The plot becomes linear when beta approaches zero and approaches Relu like curve as we keep increasing it.
Application of Swish Activation Functions in Real life scenario
Swish function is a powerful activation function which is rather useful in classification tasks. Some applications of Swish activation function are:
- In case of Image Classification (as also researched by Google), swish activation function performs better in ImageNet and other Artificial Neural Networks which suffer from vanishing gradient issues.
- Swish functions smooth gradient properties can help RNN learn long range dependencies which will be useful in text classification and Sentiment analysis task.
- This function can be applied to both Generator and Discriminator model in GANs, helping in generating better samples
Share your thoughts in the comments
Please Login to comment...