Surface plot in R
Last Updated :
02 Apr, 2024
Surface plots are three-dimensional plots that display the relationship between three variables. In R Programming Language they can be created using various packages such as plot3D, rgl, plotly, and ggplot2. Surface plots are particularly useful for visualizing the functions of two variables or exploring the interaction between two continuous variables. In this article, we will explore how to create surface plots in R using different packages, along with explanations and examples.
Using plot3D Package
The plot3D package provides functions for creating various types of 3D plots, including surface plots. Let’s create a simple surface plot using this package.
R
# Install and load the plot3D package
install.packages("plot3D")
library(plot3D)

# Generate data
x <- seq(-10, 10, length.out = 100)
y <- seq(-10, 10, length.out = 100)
f <- function(x, y) { sin(sqrt(x^2 + y^2)) / sqrt(x^2 + y^2) }

# Create surface plot
surf <- persp3D(x, y, outer(x, y, f), theta = 30, phi = 30,
                col = "lightblue", border = NA)
Output:
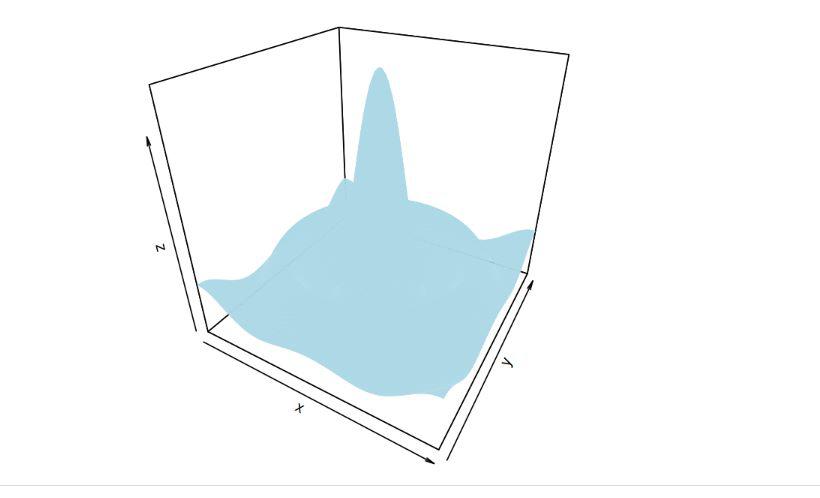
Surface plot in R
Install and load the plot3D package: This is like getting a new tool (package) for your toolbox in R. Installing and loading the plot3D package allows us to use its functions to create 3D plots, including surface plots.
- Generate data for x and y coordinates using seq() function: Imagine you’re plotting points on a graph. You need numbers to represent the positions along the x-axis and the y-axis. The seq() function helps us create a sequence of numbers to represent these positions.
- Define a function f(x, y) that represents the surface we want to visualize: Now, let’s imagine that each combination of x and y coordinates represents a point on a surface. The function f(x, y) helps us calculate the height or value of the surface at each of these points. It’s like saying, “For any given x and y, here’s how high or low the surface is at that point.”
- The persp3D() function is used to create the surface plot: This function takes our x, y, and z coordinates (where z represents the height or value of the surface at each x-y point) and creates a 3D plot that visualizes this surface. The parameters like theta and phi are like adjusting the angle from which we’re looking at this surface, just like rotating a camera to get a better view from different perspectives.
Using plotly Package
The plotly package provides functions to create interactive plots, including surface plots. Let’s create a surface plot using plotly.
R
# Install and load the plotly package
install.packages("plotly")
library(plotly)

# Generate data
x <- seq(-5, 5, length.out = 50)
y <- seq(-5, 5, length.out = 50)
f <- function(x, y) { x^2 + y^2 }

# Create surface plot
plot_ly(x = x, y = y, z = outer(x, y, f), type = "surface")
Output:
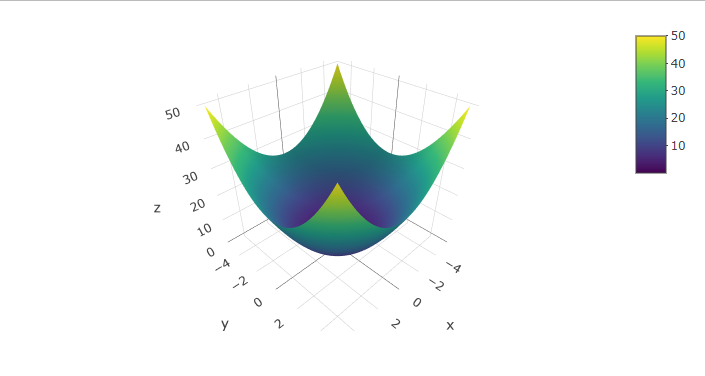
Surface plot in R
Install and load the plotly package: Imagine you’re setting up a new set of paints and brushes for a painting. Installing and loading the plotly package is like getting a special set of tools that helps you paint interactive pictures in R.
- Generate data for x and y coordinates: Think of this step as setting up a canvas. Just like a canvas has width and height, our plot needs values for the x and y axes. We use the seq() function to create a sequence of numbers that represent positions along these axes.
- Define a function f(x, y) representing the surface: Now, imagine you’re sculpting a mountain range on this canvas. The function f(x, y) is like a rule that tells you how high or low each point on this surface should be. You plug in an x-coordinate and a y-coordinate, and the function tells you how high the surface is at that point.
Use the plot_ly() function to create the surface plot: Finally, it’s time to paint the picture! The plot_ly() function takes our x, y, and z coordinates (where z represents the height or value of the surface at each x-y point) and creates an interactive surface plot. It’s like taking a brush and applying colors to the canvas based on the height information we got from our function.
Using ggplot2 Package
The ggplot2 package is widely used for creating static and dynamic graphics. Although it doesn’t directly support surface plots, we can create surface-like plots using functions like geom_raster().
R
# Load necessary libraries
library(ggplot2)
library(plotly)

# Create some sample data
x <- seq(-5, 5, length.out = 30)
y <- seq(-5, 5, length.out = 30)
z <- outer(x, y, function(x, y) sin(sqrt(x^2 + y^2)))
data <- expand.grid(x = x, y = y)
data$z <- as.vector(z)

# Plot the surface using ggplot2 and plotly
p <- ggplot(data, aes(x = x, y = y, fill = z)) +
  geom_raster() +
  scale_fill_viridis_c() +  # Using continuous viridis color scale
  theme_minimal() +
  labs(title = "Surface Plot")

# Convert ggplot to plotly
p <- ggplotly(p)

# Display the plot
print(p)
Output:
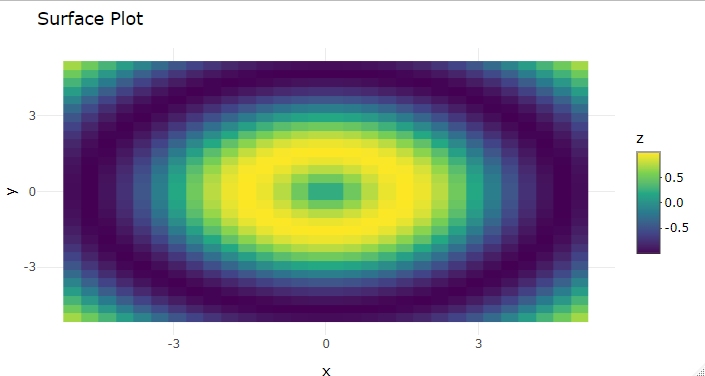
Surface plot in R
In this code, geom_raster() is used to create the surface plot, and scale_fill_viridis_c() is used to specify a continuous color scale based on the z values. This should resolve the error you encountered. If you haven’t installed the viridis package yet, you can do so by running install.packages("viridis") in your R environment.
Conclusion
In this article, we explored how to create surface plots in R using different packages. Surface plots are powerful tools for visualizing functions of two variables or exploring the relationship between continuous variables in three dimensions. Depending on your preference and requirements, you can choose the appropriate package to create surface plots in R.
Share your thoughts in the comments
Please Login to comment...