Shared legend for a cowplot grid in R
Last Updated :
24 Oct, 2021
In this article, we will discuss how to create a cowplot grid with the shared legend in the R Programming language.
To do this first we will make a basic cowplot grid with two plots having their own legends separately. To do so using the cowplot grid package in the R Language we use the plot_grid() function and pass all the plots that we need in the grid as parameters.
Syntax: plot_grid(plot1,plot2,label=<label-vector>, ncol, nrow)
Example:
A basic cowplot grid with two plots having separate legends.
R
sample_data <- data.frame(
name = c("Geek1","Geek2","Geek3",
"Geek4","Geeek5") ,
value=c(31,12,15,28,45))
library("ggplot2")
library("cowplot")
plot1<-ggplot(sample_data, aes(x=name, y=value, fill=name)) +
geom_bar(stat = "identity")
plot2<-ggplot(sample_data, aes(x="", y=value, fill=name))+
geom_bar(width = 1, stat = "identity") +
coord_polar("y", start=0)
plot_grid(plot1, plot2)
|
Output:
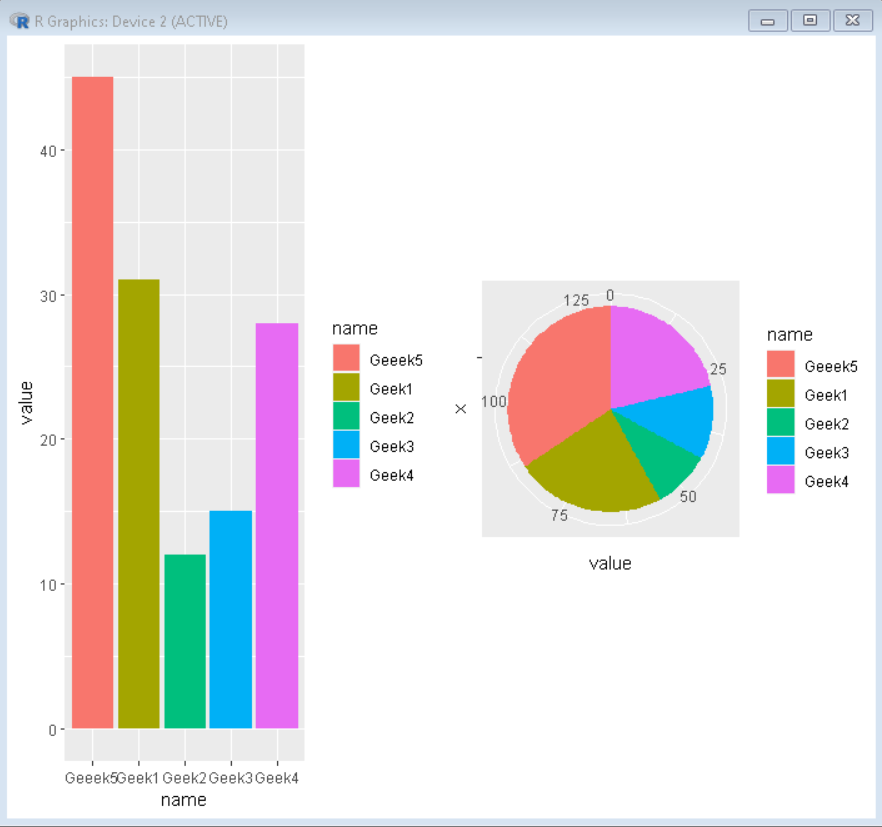
Shared Legend cowplot grid
To create a cowplot grid with shared legend there is no built-in method but the functionality can be achieved by following these steps:
Step 1: Create plots to be put in the grid without legend using:
plot + theme(legend.position = "none")
Step 2: Now combine both plots using the plot_grid() function and store that in a variable:
combined_plot<-plot_grid(plot1, plot2, ...... ncol)
Step 3: Now we extract the legend from one of the above plots to put it in the combined plot using:
legend <- get_legend( plot1 )
Step 4: Finally combine the combined plot with the derived legend using the plot_grid function to get the desired look for the shared legend plot.
plot_grid(combined_plot, legend, ncol)
Example:
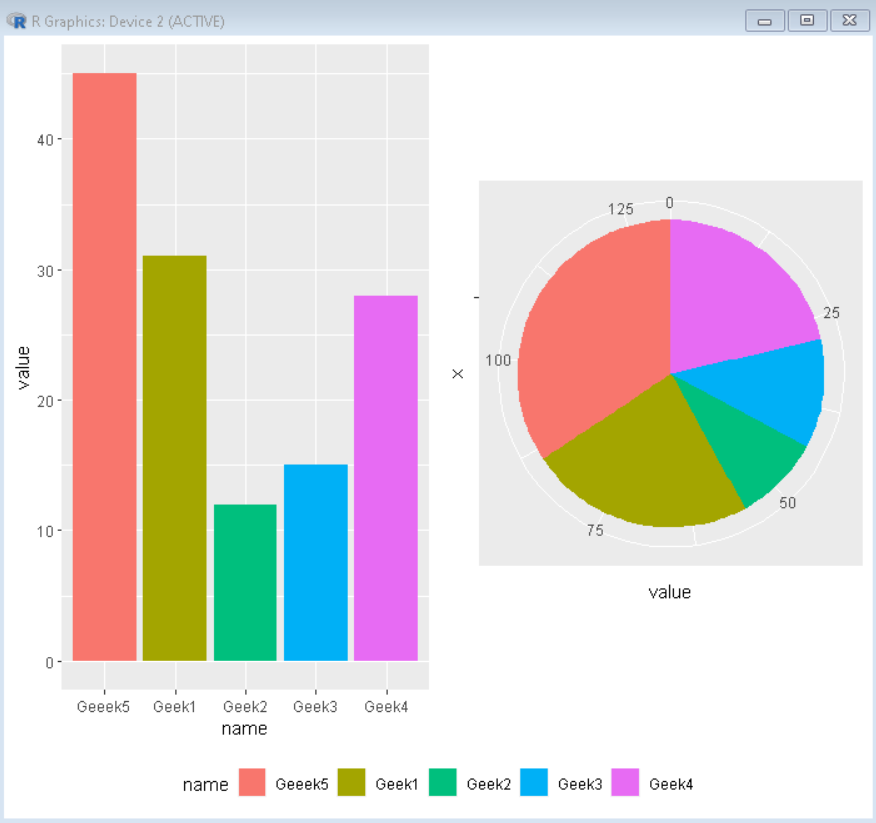
Here, is an implementation of the above approach to get a cowplot grid with shared legend.
R
sample_data <- data.frame(
name = c("Geek1","Geek2","Geek3",
"Geek4","Geeek5") ,
value=c(31,12,15,28,45))
library("ggplot2")
library("cowplot")
plot1<-ggplot(sample_data, aes(x=name, y=value, fill=name)) +
geom_bar(stat = "identity")+
theme(legend.position = "none")
plot2<-ggplot(sample_data, aes(x="", y=value, fill=name))+
geom_bar(width = 1, stat = "identity") +
coord_polar("y", start=0)+
theme(legend.position = "none")
combined_plot<-plot_grid(plot1, plot2,ncol=2)
legend <- get_legend(
plot1 +
guides(color = guide_legend(nrow = 1)) +
theme(legend.position = "bottom")
)
plot_grid(combined_plot, legend,ncol=1,rel_heights = c(1, .1))
|
Output:
Share your thoughts in the comments
Please Login to comment...