Set ggplot2 Axis Limit Only on One Side in R
Last Updated :
08 Oct, 2021
In this article, we are going to set the ggplot2 plot axis limit only on one side of the plot in the R programming language.
Using scale_x_continuous() or scale_y_continuous() function
scale_x_continuous()/scale_y_continuous() function: This function is for the default scales for continuous x or y aesthetics.
Syntax: scale_y_continuous(name = waiver(), breaks = waiver(), minor_breaks = waiver(), labels = waiver(), limits = NULL,expand = waiver(), oob = censor, na.value = NA_real_,trans = “identity”)
Parameters:
- name: The name of the scale. Used as axis or legend title.
- limits: A numeric vector of length two providing limits of the scale. Use NA to refer to the existing minimum or maximum.
- expand: A numeric vector of length two giving multiplicative and additive expansion constants.
- oob: Function that handles limits outside of the scale limits (out of bounds). The default replaces out-of-bounds values with NA.
- na.value: Missing values will be replaced with this value.
- trans: Either the name of a transformation object, or the object itself.
- …: Other arguments passed on to scale_(x|y)_continuous
Change Only One Axis Limit Using scale_y_continuous:
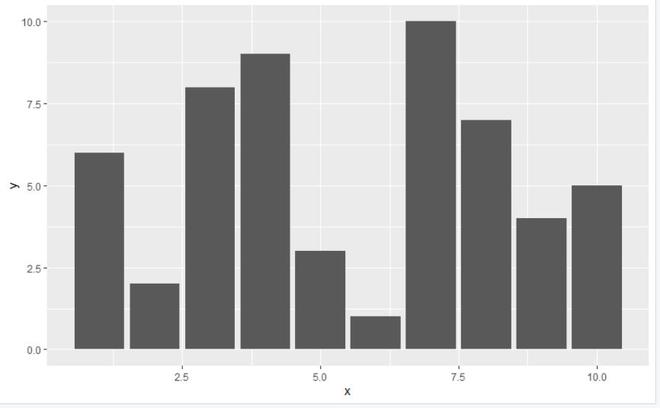
In this example, we will be plotting a ggplot2 plot of 10 data points for setting up the axis limit of only one axis which will be of y-axis using scale_y_continuous() function in the R programming language.
Initial plot with given data points look as without any changes:
R
library(ggplot2)
data < - data.frame(x=c(4, 9, 5, 6, 10, 2, 3, 7, 8, 1),
y=c(9, 4, 3, 1, 5, 2, 8, 10, 7, 6))
plot < - ggplot(data, aes(x, y)) +
geom_bar(stat="identity")
plot
|
Output:
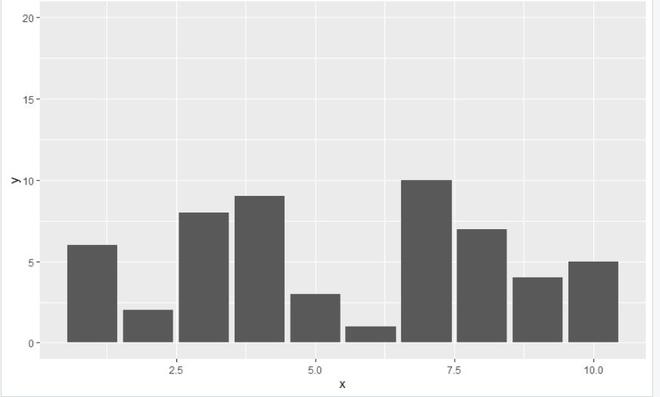
Setting up the axis limit of only one axis which will be of y-axis using scale_y_continuous() function with the given data:
R
library(ggplot2)
data < - data.frame(x=c(4, 9, 5, 6, 10, 2, 3, 7, 8, 1),
y=c(9, 4, 3, 1, 5, 2, 8, 10, 7, 6))
plot < - ggplot(data, aes(x, y)) +
geom_bar(stat="identity") +
scale_y_continuous(limits=c(0, 20))
plot
|
Output:
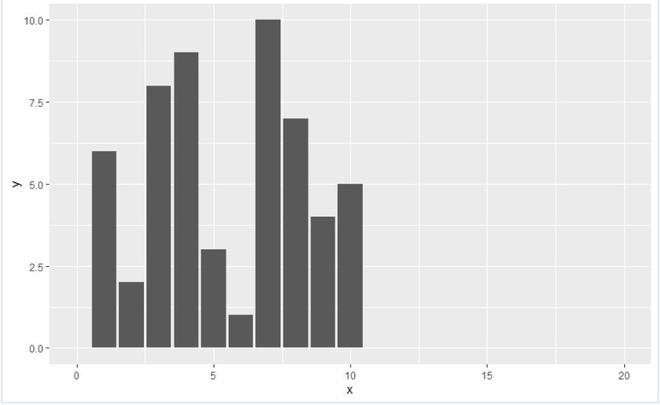
Change Only One Axis Limit Using scale_x_continuous()
In this example, we will be plotting a ggplot2 plot of 10 data points for setting up the axis limit of only one axis which will be of x-axis using scale_x_continuous() function in the R programming language.
R
library(ggplot2)
data < - data.frame(x=c(4, 9, 5, 6, 10, 2, 3, 7, 8, 1),
y=c(9, 4, 3, 1, 5, 2, 8, 10, 7, 6))
plot < - ggplot(data, aes(x, y)) +
geom_bar(stat="identity") +
scale_x_continuous(limits=c(0, 20))
plot
|
Output:
Share your thoughts in the comments
Please Login to comment...