Display Only Integer Values on ggplot2 Axis in R
Last Updated :
23 May, 2021
A dataframe to be plotted can support multiple data types in it. Sometimes a float value isn’t appropriate since it hampers the clarity and readability of the plot. Thus, if these values were plotted as integers it would easier and clearer. In this article, we will be looking at the approach to display only values on ggplot2 axis in the r language.
In this approach of displaying only integer values on ggplot2 axis, user needs to first import and load the ggplot2 library and than call the geom_point() function present in the ggplot2 package and then pass the required parameters to the function and further this function will be returning the plot of the given values.
To load and install ggplot2 package user need to follow the below syntax.
Syntax:
install.packages(“ggplot2”)
library(“ggplot2”)
Here we will plot a scatter plot and for that geom_point() is used. This function is used to plot scatter plot which is most useful for displaying the relationship between two continuous variables.
Syntax:
geom_point(mapping = NULL,data = NULL,stat = “identity”,position = “identity”,…,na.rm = FALSE,show.legend = NA, inherit.aes = TRUE)
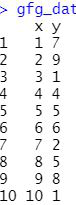
Dataset in consideration :
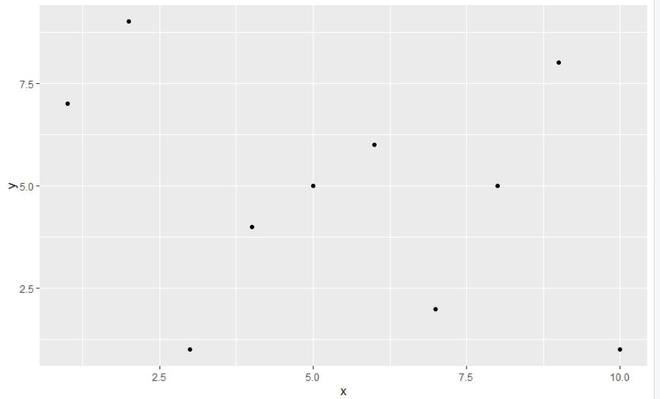
Let us first see how a regular plot without any modification of this dataframe would appear.
Example:
R
library("ggplot2")
gfg_data <- data.frame(x=c(1,2,3,4,5,6,7,8,9,10),
y=c(7,9,1,4,5,6,2,5,8,1))
gfg_plot <- ggplot(gfg_data, aes(x, y)) + geom_point()
gfg_plot
|
Output:
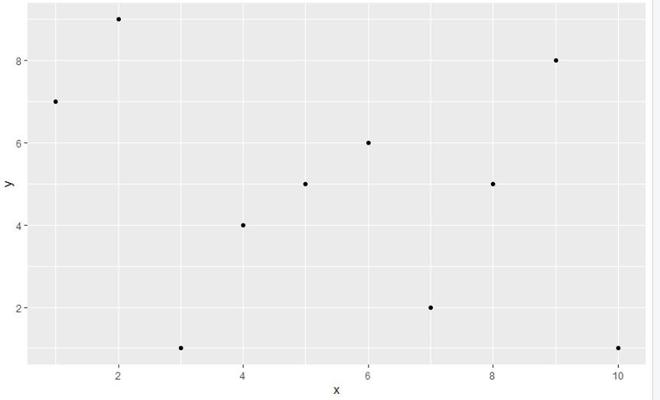
Now we will be modifying the axis values of the plot plotted by ggplot2 using geom_point() function, this improving user needs to first load and install the scales library in R programming language, then, call the scale_x_continuous() and scale_y_continuous() function which basically removes non-integer numbers from ggplot2 axes needs from scales library and pass the required parameter into this function and in return, this function will modify the plot created by ggplot2 to the well-scaled plot to the user in r language.
scale_x_continuous() and scale_y_continuous() functions are used to make continuous position scales (x & y) or removes non-integer numbers.
Syntax:
- scale_x_continuous(…, expand = waiver())
- scale_y_continuous(…, expand = waiver())
Parameter:
- …:-common continuous scale parameters: name, breaks, labels, na.value, limits and trans.
- expand:-a numeric vector of length two giving multiplicative and additive expansion constants.
Example:
R
library("ggplot2")
library("scales")
gfg_data <- data.frame(x=c(1,2,3,4,5,6,7,8,9,10),
y=c(7,9,1,4,5,6,2,5,8,1))
gfg_plot <- ggplot(gfg_data, aes(x, y)) + geom_point()
gfg_plot + scale_x_continuous(breaks = pretty_breaks())+
scale_y_continuous(breaks = pretty_breaks())
|
Output:
Like Article
Suggest improvement
Share your thoughts in the comments
Please Login to comment...