Plot Single 3D Point on Top of plot_surface in Python – Matplotlib
Last Updated :
31 Jul, 2023
Matplotlib is a widely-used plotting library in Python that offers various tools and functionalities for creating 2D and 3D visualizations. In this article, we will explore how to use Matplotlib to plot a single 3D point on top of a 3d surface plot.
Plot Single 3D Point on Top of Surface
Let us understand the Plotting single 3D point on top of the plot surface in Python using Matplotlib. To plot a single 3D point on top of a surface plot using Matplotlib in Python, you’ll need to ensure the following prerequisites are met.
Python: Make sure you have Python installed on your system. You can download the latest version of Python from the official Python website (https://www.python.org) and follow the installation instructions based on your operating system.
Matplotlib: Install the Matplotlib library, which provides plotting functionalities in Python. You can install it using the following command.
!pip install matplotlib
NumPy: Install the NumPy library, which is used for numerical computations in Python. It provides efficient array operations and mathematical functions that are useful for generating data. You can install it using the following command.
!pip install numpy
Once you have Python installed along with the required libraries, you should be ready to plot a single 3D point on top of a surface plot using Matplotlib in Python.
Step by Step process
Step 1: Import the necessary libraries
Let’s get started by importing the necessary libraries. We need NumPy for some math operations, Matplotlib for plotting, and mpl_toolkits.mplot3d for creating 3D plots.
Python
import numpy as np
import matplotlib.pyplot as plt
from mpl_toolkits.mplot3d import Axes3D
|
Step 2: Generate data for the plot_surface plot
Now, imagine we are creating a beautiful mountain landscape. We’ll generate data to create a 3D surface plot. We define the x and y coordinates using np.linspace() and create a grid of points using np.meshgrid(). Then, we calculate the z coordinate using a fancy math formula (in this case, np.sin(np.sqrt(X**2 + Y**2))). This will give us the heights of our mountain landscape.
Python
X = np.linspace(-5, 5, 100)
Y = np.linspace(-5, 5, 100)
X, Y = np.meshgrid(X, Y)
Z = np.sin(np.sqrt(X**2 + Y**2))
|
Step 3: 3D surface plot
To visualize our landscape, we need to follow below steps.
- We create a 3D figure and axes to work with using
plt.figure() and add_subplot().
Then We'll plot our mountain landscape using plot_surface(). This will create a beautiful 3D plot of our landscape with peaks and valleys. - Set labels for the x, y, and z axes using ax.set_xlabel(), ax.set_ylabel(), and ax.set_zlabel(), respectively.
- Set a title for the plot using ax.set_title().
- display the plot using
plt.show()
Python
fig = plt.figure()
ax = fig.add_subplot(111, projection='3d')
ax.plot_surface(X, Y, Z, cmap='viridis')
ax.set_title('3D Surface plot')
ax.set_xlabel('X')
ax.set_ylabel('Y')
ax.set_zlabel('Z')
plt.show()
|
Output:

Step 4: Find the x,y & z values for 3d points
Here, We are considering Single 3D points in the middle of the XY surface. So, we will consider.
point_x = Mean of X
point_y = Mean of Y
And for the z points we are considering 1.5 times of Max value of Z i.e
point_z = 1.5 * Max value of Z
Python3
point_x = X.mean()
point_y = Y.mean()
point_z = 1.5*Z.max()
print('3D point(x,y,z):',point_x,point_y,point_z)
|
Output:
3D point(x,y,z): -6.679101716144942e-17 -2.7284841053187845e-16 1.4999964535592252
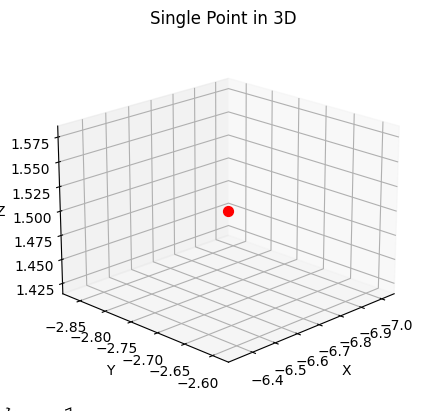
Step 5: Plot the 3d points
using ax.scatter(point_x, point_y, point_z, color='red', s=50). Specify the coordinates of the point (point_x, point_y, point_z) and customize the appearance (color, size)
Python
fig = plt.figure()
ax = fig.add_subplot(111, projection='3d')
ax.scatter(point_x, point_y, point_z, color='red', s=50)
ax.set_xlabel('X')
ax.set_ylabel('Y')
ax.set_zlabel('Z')
ax.set_title('Single Point in 3D')
ax.view_init(elev=20, azim=45)
plt.show()
|
Output:
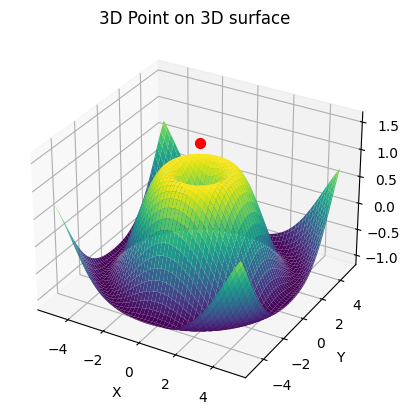
Single 3D Point on Top of Surface Full code
To plot the Single 3D Point on Top of the Surface, we will merge both the above graph using the bellow code
- Generate data for the plot_surface plot
- Create a 3D figure and axes
- PLot 3D surface using ax.plot_surface()
- Compute 3D point (x,y,z) coordinate
- Plot the single 3d point on the same axis
Python3
import numpy as np
import matplotlib.pyplot as plt
from mpl_toolkits.mplot3d import Axes3D
X = np.linspace(-5, 5, 100)
Y = np.linspace(-5, 5, 100)
X, Y = np.meshgrid(X, Y)
Z = np.sin(np.sqrt(X**2 + Y**2))
fig = plt.figure()
ax = fig.add_subplot(111, projection='3d')
ax.plot_surface(X, Y, Z, cmap='viridis')
point_x = X.mean()
point_y = Y.mean()
point_z = 1.5*Z.max()
print('3D point(x,y,z):',point_x,point_y,point_z)
ax.scatter(point_x, point_y, point_z, color='red', s=50)
ax.set_xlabel('X')
ax.set_ylabel('Y')
ax.set_zlabel('Z')
ax.set_title('3D Point on 3D surface')
plt.show()
|
Output:
3D point(x,y,z): -6.679101716144942e-17 -2.7284841053187845e-16 1.4999964535592252
Share your thoughts in the comments
Please Login to comment...