Memory Tool in Microsoft Edge Browser
Last Updated :
30 Oct, 2023
The Memory Tool in Edge allows you to capture the memory heap and provides various views to view that information. The tool provides various profiles for capturing web page memory information. The information mainly consists of retained size and shallow size, which provide information about the object’s actual size and the size memory after garbage collection.
The various benefits of the memory tool are:
- Multiple Views: The tool provides a pie chart, summary, containment, and many other views, which is useful to visualize the memory consumption of the tool as the developers can get the necessary information at a glance.
- Simple UI: The UI is simple to use, and the data is organized in a tabular format. There is a very low learning curve when using this tool, and users can get the hang of it pretty easily.
- Option for garbage collection: You also have the option to manually activate the garbage collector in case the browser can find the unused object to be garbage collected.
- Identify Memory Leaks: The memory information about JS objects and DOM nodes can be used to check if there are any detached elements left out that are not garbage collected, as they can create memory leaks.
- Options to select a JS VM instance: You can select from various JS instances running on the web page for profiling. This helps to inspect the memory of frames used in the web page.
The tool is present as a tab in DevTools. The DevTools can be opened in Edge using the shortcut F12 or “Ctrl+Shift+I.” Alternatively, you can right-click on the webpage and then select Inspect to open DevTools. In DevTools, there are multiple ways to open the tool, which are:
- Using the Add button: At the end of the main toolbar, you will find an Add button (+). If you click the add button, you will find a list of tools.
- Using More Tools: In the top-right corner of DevTools, there will be three vertical dots. Click on them. Then navigate to More Tools > Memory from the menu that appears.
- Using Run Command: To open the run command, use the shortcut “Ctrl+Shift+P” or select Run Command from the menu in the three dots button, which is present in the top-right corner of DevTools. In the Run Command search menu, type Memory, and then select Show Memory from the list of options that appears.
Opening Memory Tool in multiple ways
The Memory Tool UI can be divided into two sections: Profiling Sidebar and Profiling Details.
UI of Memory Tool
Profiling Sidebar
In the sidebar, you will find various options and snapshots list.
Profiling Sidebar
- Start/Stop Profiling: Press this button to start or stop taking the snapshot. Except for heap snapshots in the other two profiles, you have to manually press the stop profiling button.
- Clear all profiles. Press this button to clear all the snapshots you have taken. You can delete a particular snapshot by right-clicking the snapshot and selecting Delete.
- Collect garbage: Press this button to manually activate the garbage collector.
- Save: Press this button to export the snapshot as an.heaptimeline JSON file.
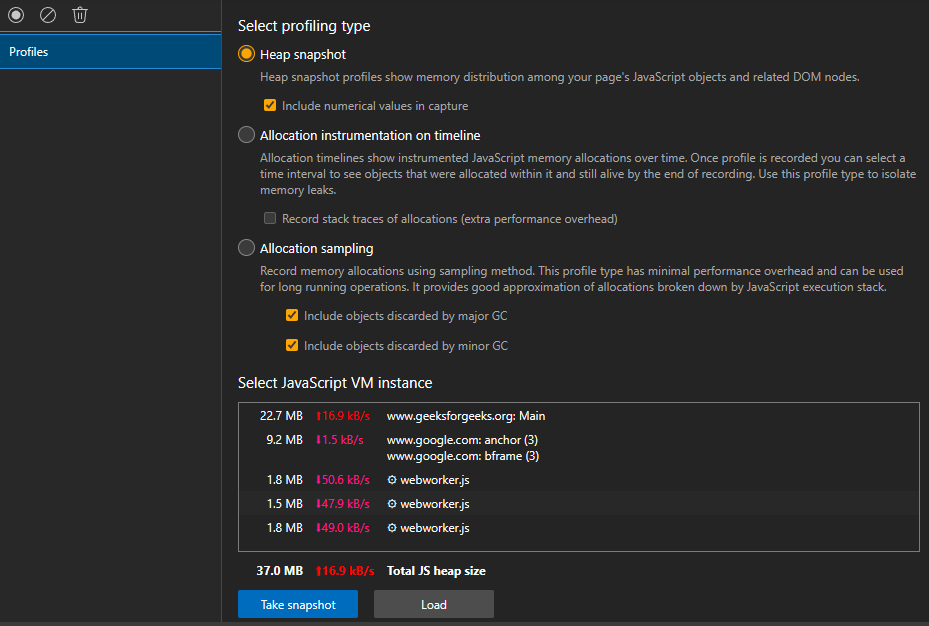
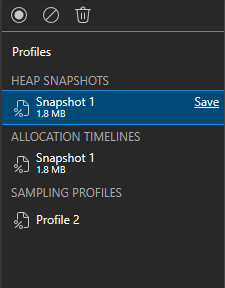
- Profiles: You can use this pane to select various profiles and JS instances. The profiles are heap snapshots, allocation instrumentation on timelines, and allocation sampling.
- Head Snapshots: Under this category come all the heap snapshots.
- Allocation Timelines: Under this category come all the Allocation Timelines snapshots.
- Sampling Profiles: Under this category come all the Sampling Profile snapshots.
Profiling Details
This section of the Memory Tool displays details of the selected snapshot profile present in the profiling sidebar. You may encounter some columns that are shallow size and retained size. The shallow size is the object’s actual size in memory and the retained size is the memory freed after garbage collection.
Profiles Details
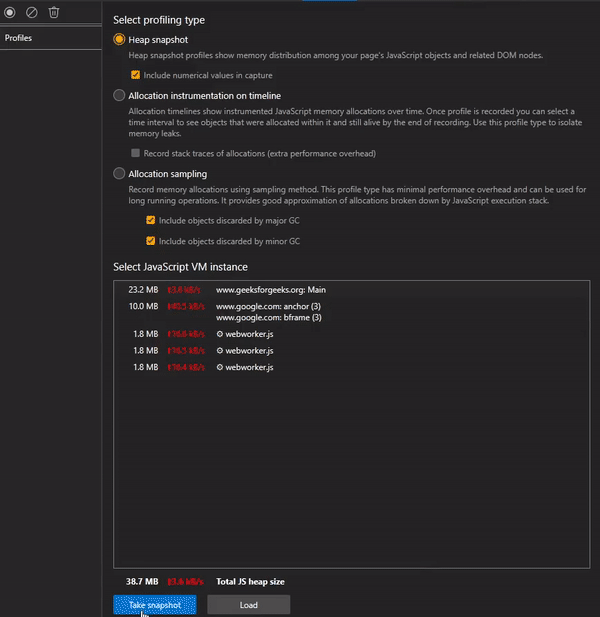
If you click Profiles in the sidebar, you get this pane. Here you can select the various snapshot profiles and JS instances. You have a start/stop button to start and stop capturing and a load button to import snapshots with an.heaptimeline extension.
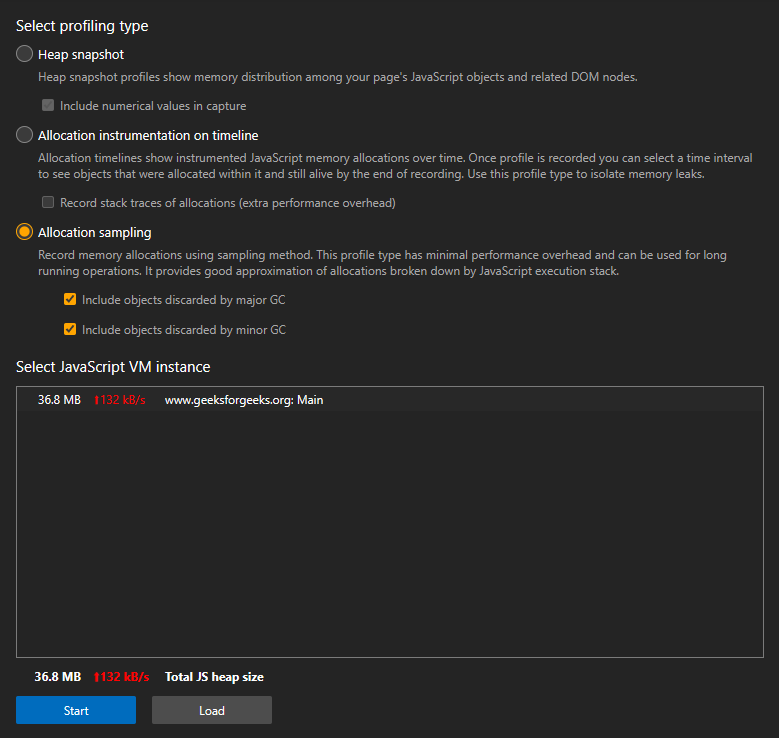
- Heap snapshot: Use this profile if you want memory details about JS objects and DOM nodes. You can also check Include numerical values in capture if you want numerical values to be displayed in the memory details.
- Allocation instrumentation on the timeline: used this profile to isolate memory leaks by inspecting JS objects memory with respect to timeline. You can check the record stack traces of allocations to view the call stacks.
- Allocation sampling: I used this profile to get an overview of the JS executed stack, and the time of capturing can be spanned longer because of less overhead. You can check Include objects discarded by major or minor GC to inspect and reduce the garbage operations in the code.
- Select the JavaScript VM instance: This section will display all the JS instances running on the web page. You can select anyone to capture that instant memory snapshot.
Profile pane Details
Various views for the snapshot:
- Summary view: You get information about all the constructors of the JS instance selected for the snapshot. The various options you get in this view are:
- Class Filter: It’s a search bar where you can search for classes from the listed constructors.
- Filter objects on the basis of allocation time: You can select to display all the files or objects allocated before or after the snapshots.
- Filter various JS constructs: You can also check or uncheck the various JS constructs to be listed.
- Save all to file: If there is a string constructor, then you get an option called Save all to file to save the strings in a JSON file.
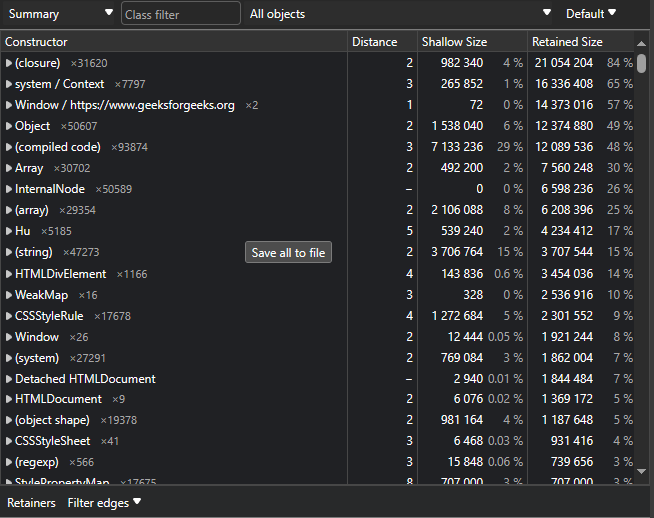
Summary view
- Comparison view: You can compare the currently selected snapshot with other heap snapshots in this view. You get a drop-down list of all possible snapshots with which you can compare the currently selected snapshots.
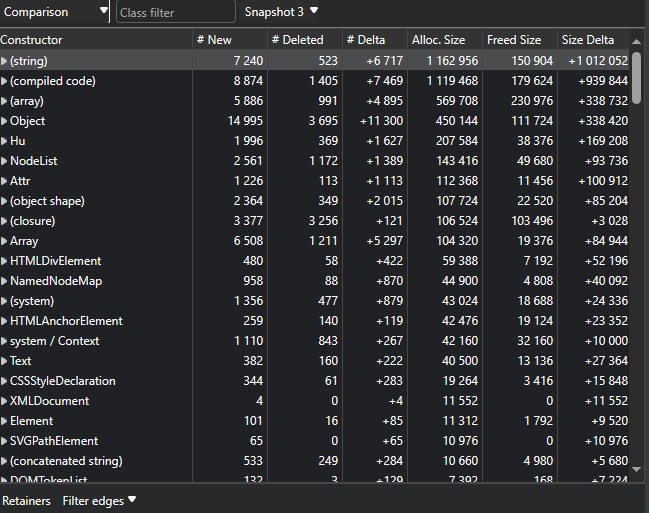
Comparison view
- Containment view: This view displays the object structure which helps to analyze who’s calling the object. The view is useful to get the list of all top parent objects present in the JS code.
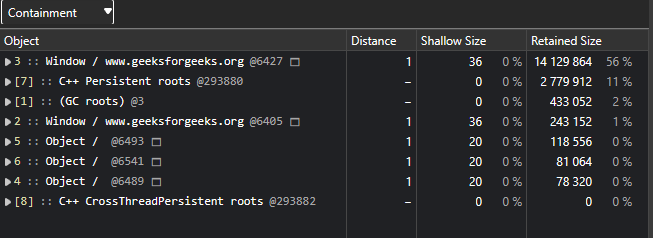
Containment view
- Containment Diff view: This view displays the diff between two snapshots of object structure size. Very useful to only get the details of objects that are found in one snapshot when compared with others.
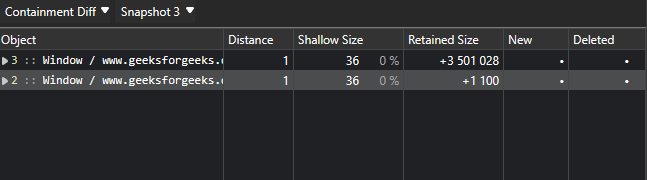
Containment diff view
- Statistics View: Provides a pie chart for various JS construct memory usages. Very useful if you want the summary about which JS construct is consuming what amount of memory.
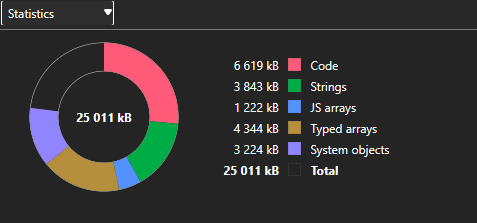
Statistics view
- Allocation view: It displays the live count, count, live size, and size of the functions. This view is useful to check the use of various functions and the memory consuming the information can later be used to modify the function or remove it completely.
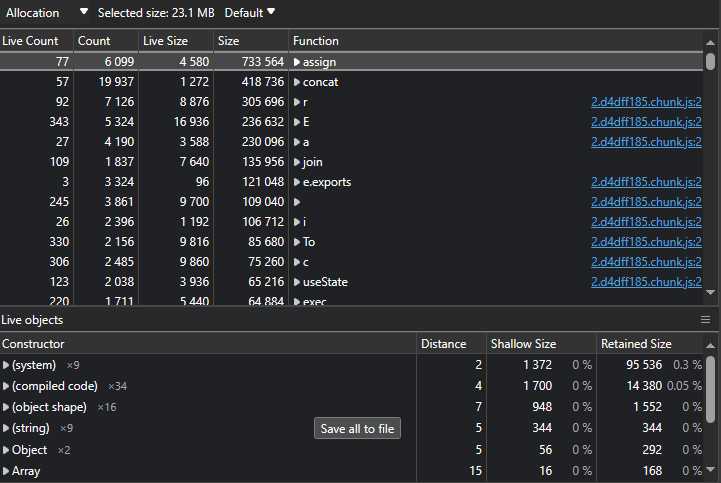
Allocation view
- Chart view: Provides charts of various functions and their respective memory size. This view is very useful to summarize the various functions with respect to the call stack and memory consumption.
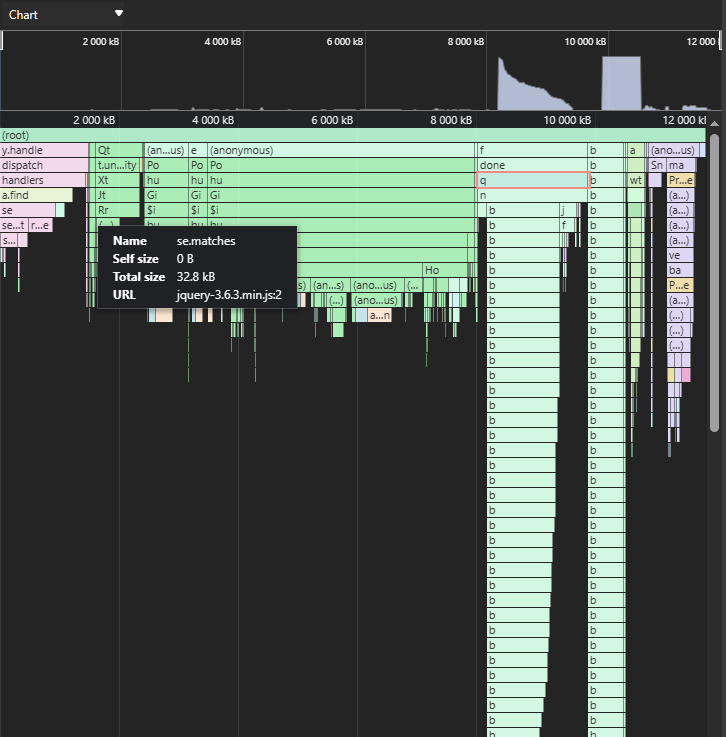
Chart view
- Heavy (Bottom Up) view: This view displays the functions at the top that allocate the most memory. This can be used to inspect and determine the most memory-used function. It also provides some options that are:
- Focus selected function: The eye button appears when you select a function. It is used to focus and get details of only that selected function.
- Exclude selected function: The cross button is used to remove the selected function from the view.
- Restore all functions: Whatever changes you made with the focus and exclude buttons can be restored using this refresh-looking button.
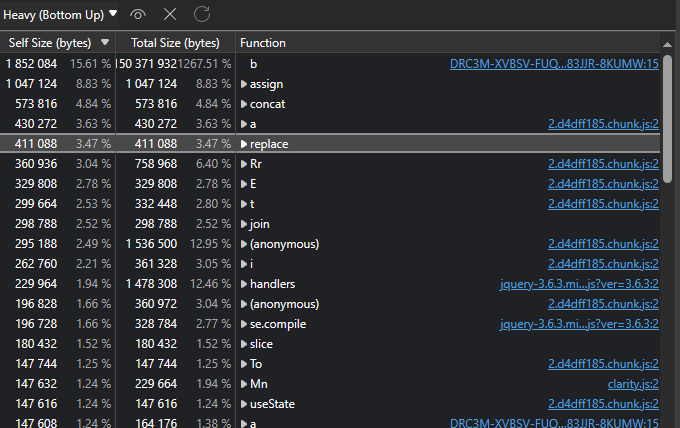
Heavy view
- Tree (Top Down) view: This view displays the tree of function calls where each node represents a function call and its children. Its view is useful for checking the call stack of functions.
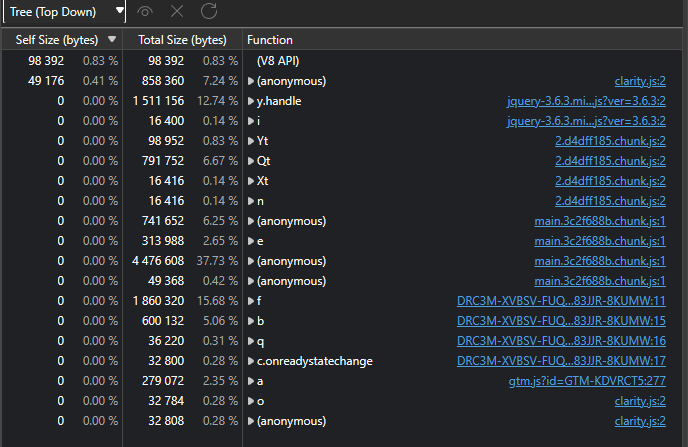
Tree view
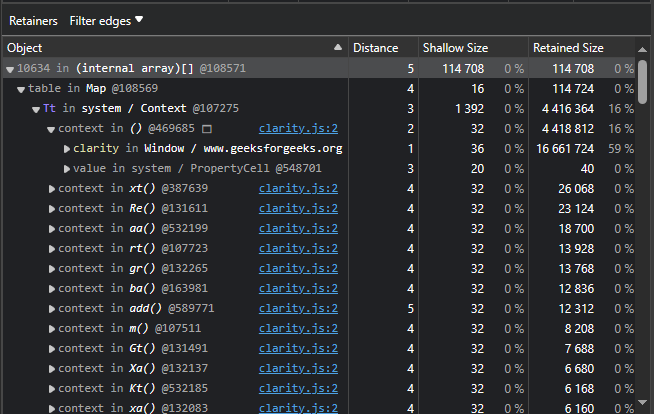
Object table
In the heap snapshot and Allocation Timelines Snapshot you can select an object to get more information about it in a table. The table is presented below with various views in the Profile details section. At the top of this table, you will find a filter option Retainers which is under to hides internal and cycled node objects.
Object table
Let’s use the Memory Tool to inspect the memory usage of the GFG site.
Step 1: Using Edge visit the GFG site and then locate the Memory tool in DevTools.
Step 2: Use the Memory tool to take snapshots and inspect the memory usage of JS code in the site.
Using the Memory Tool on the GFG site
The developers need to design sites that have memory usage that a normal user system can handle. The Edge provides the memory tool to inspect and debug memory-related problems in the web page’s JS code.
Share your thoughts in the comments
Please Login to comment...