Memory Tab in Brave Browser
Last Updated :
30 Apr, 2024
Developers rely on the Memory tab in Brave Browser’s Developer Tools to gain insights into how much memory a web page uses. This tab provides a detailed overview of memory-related information, such as DOM nodes, event listeners, JavaScript memory usage, and more. By utilizing this tool, developers can detect memory leaks, inefficient memory utilization, and wasteful resource usage, ultimately improving the stability and speed of online applications.
Features of the Memory Tab
- Snapshot Comparison: The “Take Snapshot” option allows developers to capture and compare snapshots of an application’s memory usage in different states, aiding in the detection of memory usage, leaks, or modifications.
- Dedicated Heap Profiler: This profiler assists in complicated memory analysis, displaying JavaScript heap allocations and tracking objects and functions that use memory.
- Garbage Collection Insights: By displaying information about the memory schedule and use of the JavaScript engine, developers gain insights into garbage collection events.
Benefits of the Memory Tab
- Memory Leak Detection: Developers can pinpoint areas where resources are not being released appropriately, enhancing the stability and speed of web applications.
- DOM Node Analysis: Developers can assess how much memory each DOM node uses, optimizing the DOM structure and boosting application effectiveness.
- JavaScript Memory Usage Evaluation: By examining which areas of the code utilize a lot of memory, developers can optimize code and develop more efficient programs.
Steps to Open the Memory Tab
- Right-Click on an Active Tab: Start by right-clicking on an active tab within the Brave Browser window. This can be any tab that is currently open and displaying a webpage.
- Select “Inspect”: From the context menu that appears after right-clicking, select the “Inspect” option. This will open the Developer Tools panel.
- Navigate to the Memory Tab: In the Developer Tools panel, you’ll see a row of tabs at the top. Click on the “Memory” tab to switch to the Memory tool.
- Review Memory Information: Once you’ve opened the Memory tab, you’ll see various sections and tools related to memory usage. You can explore these to view detailed information about how the webpage is utilizing memory.
- Analyze Memory Usage: Use the tools and features within the Memory tab to analyze memory usage, identify any potential issues such as memory leaks or excessive memory consumption, and optimize memory usage for better performance.
Various Types of Memory Profiling
The Memory tab in Brave Browser’s Developer Tools offers various types of memory profiling to help developers analyze and optimize memory usage in web applications. These profiling types provide detailed insights into how memory is allocated and used by the application’s JavaScript code and related DOM nodes. Here’s a detailed look at each type:
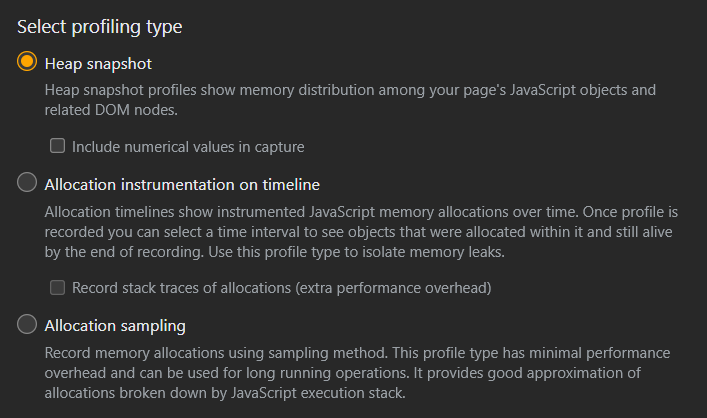
- Heap Snapshot: This profiling type provides a snapshot of the memory heap at a specific point in time. It shows the memory usage among a page’s JavaScript objects and related DOM nodes. Developers can use heap snapshots to identify memory leaks, understand memory allocation patterns, and optimize memory usage. Heap snapshots display a hierarchical view of objects, making it easier to visualize memory usage and identify potential issues.
- Allocation Instrumentation on Timeline: This profiling type focuses on tracking instrumented JavaScript memory allocations over time. It helps in identifying memory leaks by showing when and where memory is allocated during the execution of JavaScript code. By analyzing allocation timelines, developers can pinpoint areas of code that are causing excessive memory usage and optimize them for better performance. This profiling type is particularly useful for long-running operations where memory usage needs to be monitored continuously.
- Allocation Sampling: Allocation sampling records memory allocations using a sampling method, providing a statistical approximation of allocations broken down by the JavaScript execution stack. It offers a lightweight way to monitor memory usage without incurring significant performance overhead. Allocation sampling is useful for identifying memory-intensive routines or variables in the code, helping developers optimize memory usage and improve overall application performance.
Example Showing Usage of the Memory Tab
- Open the memory tab (in the developer console) by pressing Ctrl + Shift + i.
- Select the profiling type (e.g., Heap snapshot).
- Click on the “Take Snapshot” button to gather information.
- View a list of memory-using applications associated with the web page and the browser.
.gif)
Conclusion
The Memory tab in Brave Browser’s Developer Tools is an essential tool for developers aiming to enhance the speed and reliability of their applications. By providing detailed memory usage information, it enables developers to detect and fix memory-related issues, ultimately leading to the development of more reliable and efficient web applications.
Share your thoughts in the comments
Please Login to comment...