Console Tab in Safari Browser
Last Updated :
01 Dec, 2023
The developed Console Tab of Safari can be categorized as a crucial element that allows developers and end users engagement, troubleshooting, and performance tuning. It is part of the Web Inspector, a group of development and debugging tools built into the Safari browser. The console acts both as a command line as well as a logging system enabling you to learn what is happening on your web page such as its structure, javascript errors, network activities, etc.
Types of Console in Safari
The Console in Safari primarily encompasses two types:
- JavaScript Console
- Web Inspector Console
Errors, warnings, and other informational messages pertaining to the running of Java Script on a particular page are presented in the console. On the other hand, the Web Inspector Console provides more comprehensive debugging tools and features for an entire page.
Uses of Console tab.
- Efficient Debugging: This makes it easy to find errors while at the same time giving detailed information on what went wrong and also to step through the code line-by-line.
- Real-Time Modifications: This enables developers to test code, CSS, and HTML elements, and see what changes will be observed immediately.
- Performance Optimization: Network traffic and resource load time provide insights into how to improve web page performance.
- Error Identification: It allows you to track down and fix specific situations like JavaScript bugs, resource loading issues, and so on.
Benefits of Safari’s Console Tab
- Error Reporting: The console tab on Safari captures diverse categories of messages that could help trace bugs in the code base during the running of a web page. There exist three types of messages known to include errors, warnings, and information that act as vital indicators to developers. Errors indicate significant problems that can prevent the operation of a program. Warnings show less important issues worth noticing during processing. Beyond the behavior of a page, informational messages provide more information. Detailed logs help the programmers trace back these issues to their source hence easy debugging and problem solving.
- Live Interaction: The console tab is not just a reporting feature; instead, it is a place of interaction where one can act on the code and the web page directly. This is a live interaction platform for developers, which they can use to write, run, and test JavaScript commands in real-time. Moreover, it enables one to make minor changes in the code blocks and see how they affect the website. The presence of such an instantaneous feedback loop allows for quick alterations with an opportunity to monitor resulting changes and therefore shorten the process of developing as well as debugging.
- Network Monitoring: The Console tab on Safari has additional features that comprise of other network monitoring tools apart from its roles with Java-Script and code-level debugging. Therefore, this enables the developer to trace and monitor any kind of network activities which include the time duration for every request and response. It gives a thorough understanding of resources loaded and network behaviour giving the developer an idea about the possible page bottlenecks during loading. As such, understanding how networks are busy is critical in order to minimize page load times, while the Console tab provides insights into on-page behavior.
How and When to Use the Console Tab in Safari
- Debugging: In case you encounter a problem while browsing an issue, you should try first checking the Console Tab of safari which will help you find an issue quickly and take care of it faster than any other available solution. It logically tracks errors, warning and info messages, in the way that all possible problems will be clearly identified along with their sources. In this aspect, it simplifies the debugging thereby making the debugging faster and quicker as compared to the earlier methods.
- Code Testing and Development: Developer’s tool, it is essentially like a sandbox that is alive. They can try out some javascripts and also adjust some CSS or HTML in real-time. Through this mechanism, any changes can be immediately tested before being embedded in the real codebase thus guaranteeing a smoother and more approved development.
- Performance Optimization: The Console Tab gives information on various aspects such as network activity, loading resource times, etc., which can help in optimizing webpage performance. Developers will use this technique for monitoring network requests in order to establish loading time as a measure of performance problems which then leads to an improved user experience.
Steps to Use Console Tab in Safari
Accessing the Console:
- Navigate to the Webpage: Start with Safari and enter the required web page.
- Access Web Inspector: Click with another button, somewhere in the page. Alternatively, either select “Inspect Element” from the dropdown menu or press Option + Command + I on a Mac computer or Ctrl + Shift + I on a Windows machine to activate the Web Inspector.
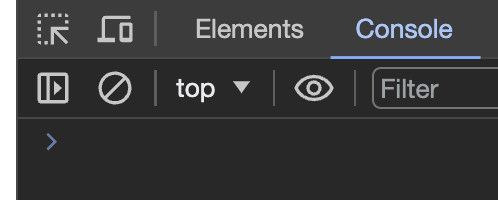
- Go to the “Console” Tab: The errors log, javascript command, as well as the network information for a web page can be accessed in console tab within the web inspector.
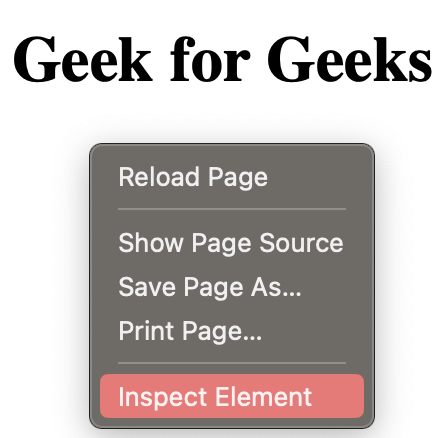
Inspect any element on the webpage
Opening console
Interface Exploration:
- Input and Output Sections: Enter and run JS commands here. Output shows logs, errors, and the network data.
- Console Features: Discover all possible devices like logs, events, and messaging screening.
Debugging and Execution:
- Error Troubleshooting: Identify and resolve your errors efficiently via error logs.
- Live Code Modification: Test JavaScript commands, modify HTML/CSS elements, and observe immediate changes on the webpage for quicker code validation.
- Network Monitoring: Inspect network activities, analyze response times, and identify potential performance bottlenecks for enhanced webpage loading
Resolviing erorrs efficiently
1. Command Line Interface (CLI):
The command line interface enables direct access of the Java script console. It’s one of the most efficient means of running JavaScript operations and debugging programs in real-time. Type your javascript code and hit enter.
Command line interface
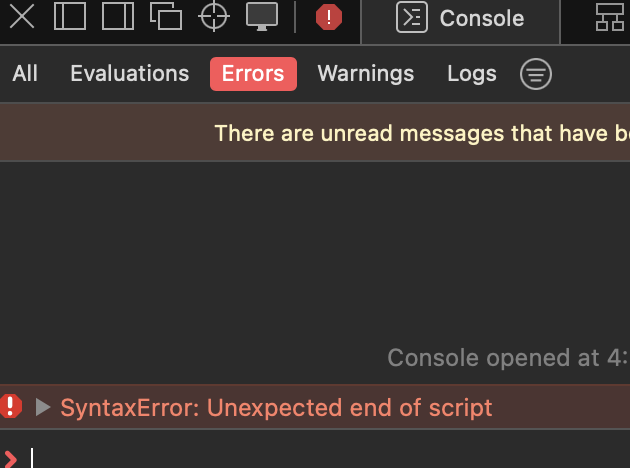
2. Error Messages:
Among others, the Console tab is an error center from which such messages are displayed. In case of any error associated with your web page’s JavaScript, this section will provide a list of errors. Error clicking often takes you directly to the offending section of the source code.
Error Messages
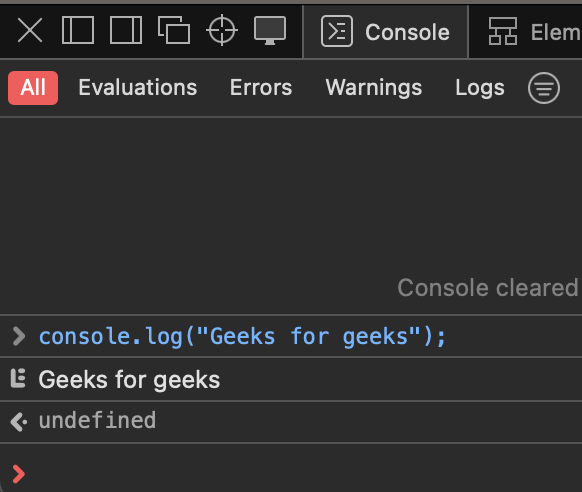
3. Console Logs:
Console.log is a method that developers often use for displaying messages in order to diagnose problems. Developers can follow the flow of their code by reading these messages on console tab.
console.logs
4. Event Listeners:
The “Event listeners” tab shows the event listeners to different elements of a page. With this data, you will know which regions react whenever the user taps or clicks on them.
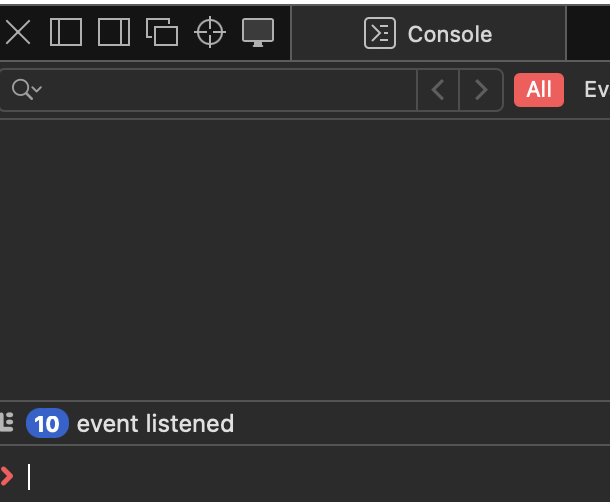
Event listeners
5.Clear console button:
Users can clear the editor tab by clicking this button.
Clear console button
Example Showing Usage in Safari’s Console Tab
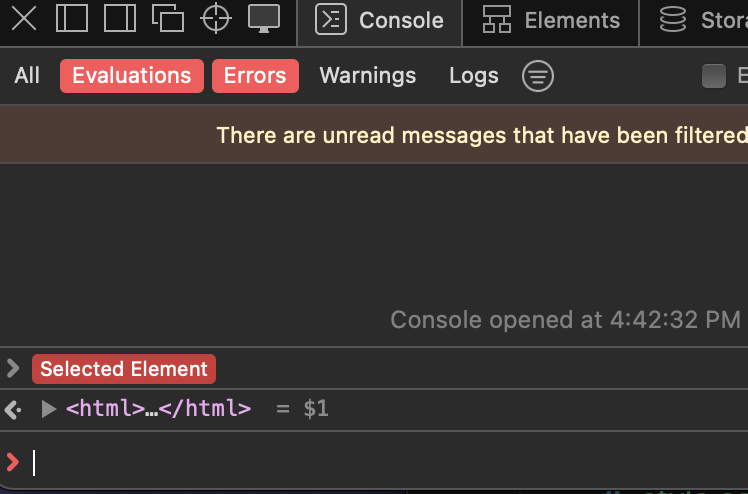
What happens when a web page has a JavaScript error? In order to see the error details, trace the source, and correct it, the developers open the Console Tab. The image below illustrates the process of discovering and fixing problem utilizing Console Tab in Safari.
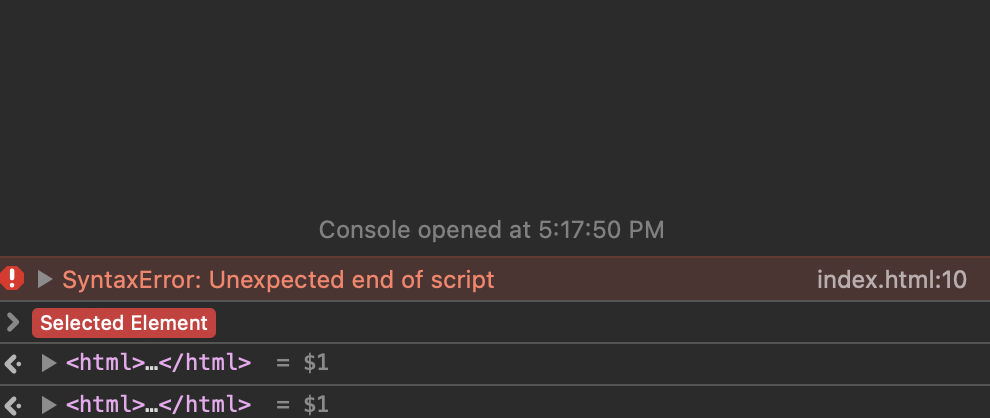
Error detected in console tab
This should give a thorough overview of the Console Tab in Safari, its functionalities, and how developers can effectively leverage it for debugging and optimizing web pages.
Conclusion
The Console Tab in Safari turns out to be a vital companion of developers who are walking through the complicated web development path. It is an important piece of the Web Inspector tool bag that includes error reporting in real time, live interchanging, network watching performance investigation. However, as a means of more than just debugger, Console Tab rises above its status of mere identification and rectification of errors.
Share your thoughts in the comments
Please Login to comment...