Matplotlib.axes.Axes.fill() in Python
Last Updated :
13 Apr, 2020
Matplotlib is a library in Python and it is numerical – mathematical extension for NumPy library. The Axes Class contains most of the figure elements: Axis, Tick, Line2D, Text, Polygon, etc., and sets the coordinate system. And the instances of Axes supports callbacks through a callbacks attribute.
matplotlib.axes.Axes.fill() Function
The Axes.fill() function in axes module of matplotlib library is used to plot filled polygons.
Syntax:
Axes.fill(self, *args, data=None, **kwargs)
Parameters: This method accept the following parameters that are described below:
- *args: These parameter are the lists of x and y positions of its nodes, optionally followed by a color specifier.
- data: This parameter is an optional parameter and it is an object with labelled data.
Returns: This returns the list of Polygon.
Below examples illustrate the matplotlib.axes.Axes.fill() function in matplotlib.axes:
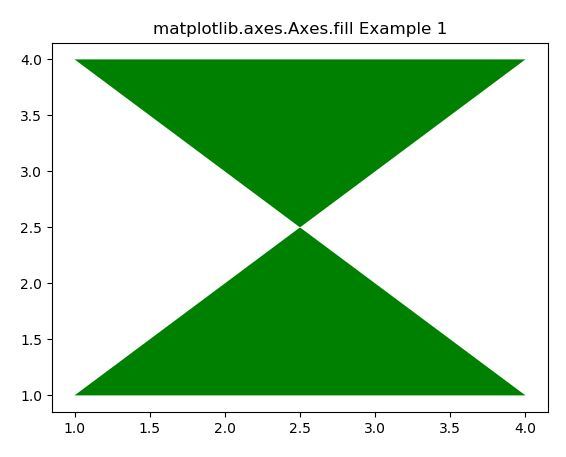
Example-1:
import numpy as np
from matplotlib import patches
import matplotlib.pyplot as plt
x = np.array([1, 4, 1, 4])
y = np.array([1, 1, 4, 4])
fig, ax1 = plt.subplots()
ax1.fill(x, y, facecolor ='green')
ax1.set_title('matplotlib.axes.Axes.fill Example 1')
plt.show()
|
Output:
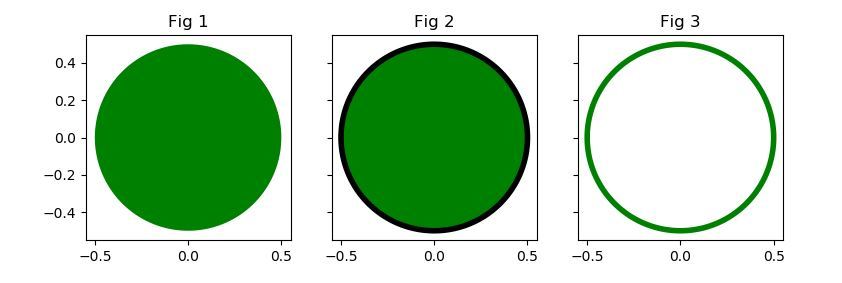
Example-2:
import numpy as np
from matplotlib import patches
import matplotlib.pyplot as plt
theta = np.deg2rad(np.arange(0.0, 360.0, 1.0))
x = 0.5 * np.cos(theta)
y = 0.5 * np.sin(theta)
fig, (ax1, ax2, ax3) = plt.subplots(1, 3, figsize =(9, 3),
subplot_kw ={'aspect': 'equal'},
sharey = True)
ax1.fill(x, y, facecolor ='green')
ax1.set_title('Fig 1')
ax2.fill(x, y, facecolor ='green', edgecolor ='black',
linewidth = 4)
ax2.set_title('Fig 2')
ax3.fill(x, y, facecolor ='none', edgecolor ='green',
linewidth = 4)
ax3.set_title('Fig 3')
plt.show()
|
Output:
Share your thoughts in the comments
Please Login to comment...