Matplotlib.axes.Axes.contourf() in Python
Last Updated :
13 Apr, 2020
Matplotlib is a library in Python and it is numerical – mathematical extension for NumPy library. The Axes Class contains most of the figure elements: Axis, Tick, Line2D, Text, Polygon, etc., and sets the coordinate system. And the instances of Axes supports callbacks through a callbacks attribute.
matplotlib.axes.Axes.contourf() Function
The Axes.contourf() function in axes module of matplotlib library is also used to plot contours. But contourfdraw filled contours, while contourf draws contour lines.
Syntax:
Axes.contourf(self, *args, data=None, **kwargs)
Parameters: This method accept the following parameters that are described below:
- X, Y: These parameter are the coordinates of the values in Z.
- Z : This parameter is the height values over which the contour is drawn.
- levels : This parameter is used to determine the numbers and positions of the contour lines / regions.
Returns: This returns the following:
- c :This returns the QuadContourSet.
Below examples illustrate the matplotlib.axes.Axes.contourf() function in matplotlib.axes:
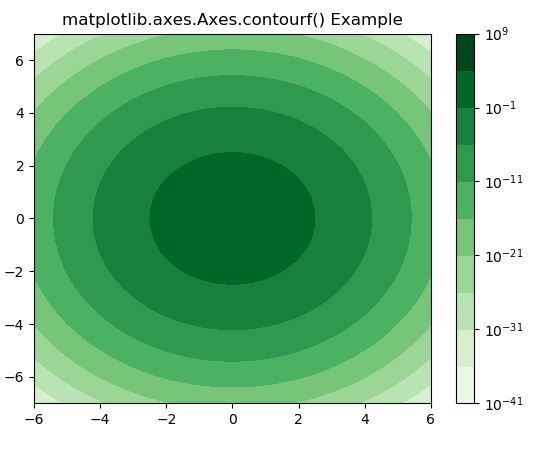
Example-1:
import numpy as np
import matplotlib.pyplot as plt
from numpy import ma
from matplotlib import ticker, cm
N = 1000
x = np.linspace(-6.0, 6.0, N)
y = np.linspace(-7.0, 7.0, N)
X, Y = np.meshgrid(x, y)
Z1 = np.exp(-(X)**2 - (Y)**2)
z = 50 * Z1
z[:5, :5] = -1
z = ma.masked_where(z <= 0, z)
fig, ax = plt.subplots()
cs = ax.contourf(X, Y, z, locator = ticker.LogLocator(),
cmap ="Greens")
cbar = fig.colorbar(cs)
ax.set_title('matplotlib.axes.Axes.contourf() Example')
plt.show()
|
Output:
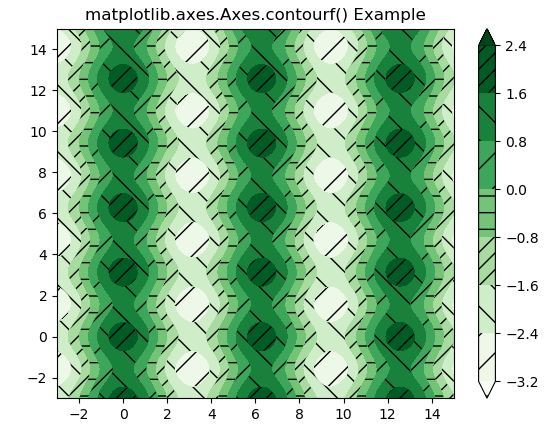
Example-2:
import matplotlib.pyplot as plt
import numpy as np
x = np.linspace(-3, 15, 450).reshape(1, -1)
y = np.linspace(-3, 15, 720).reshape(-1, 1)
z = np.cos(x)*2 - np.sin(y)**2
x, y = x.flatten(), y.flatten()
fig1, ax1 = plt.subplots()
cs = ax1.contourf(x, y, z, hatches =['-', '/', '\\', '//'],
cmap ='Greens', extend ='both', alpha = 1)
fig1.colorbar(cs)
ax1.set_title('matplotlib.axes.Axes.contourf() Example')
plt.show()
|
Output:
Like Article
Suggest improvement
Share your thoughts in the comments
Please Login to comment...