Matplotlib.axes.Axes.spy() in Python
Last Updated :
13 Apr, 2020
Matplotlib is a library in Python and it is numerical – mathematical extension for NumPy library. The Axes Class contains most of the figure elements: Axis, Tick, Line2D, Text, Polygon, etc., and sets the coordinate system. And the instances of Axes supports callbacks through a callbacks attribute.
matplotlib.axes.Axes.spy() Function
The Axes.spy() function in axes module of matplotlib library is also used to plot the sparsity pattern of a 2D array.It is also used to visualize the non-zero values of the array.
Syntax: Axes.spy(self, Z, precision=0, marker=None, markersize=None, aspect=’equal’, origin=’upper’, **kwargs
Parameters: This method accept the following parameters that are described below:
- Z : This parameter is the array which is to be plotted.
- precision : This parameter is used to determine whether any non-zero value is to be plotted or not.
- origin : This parameter place the [0, 0] index of the array in the upper left or lower left corner of the axes.
- aspect : This parameter is an optional and it is used to control the aspect ratio of the axes.
Returns: This returns the following:
- ret:This returns the AxesImage or Line2D. And it depend on style of plotting
Below examples illustrate the matplotlib.axes.Axes.spy() function in matplotlib.axes:
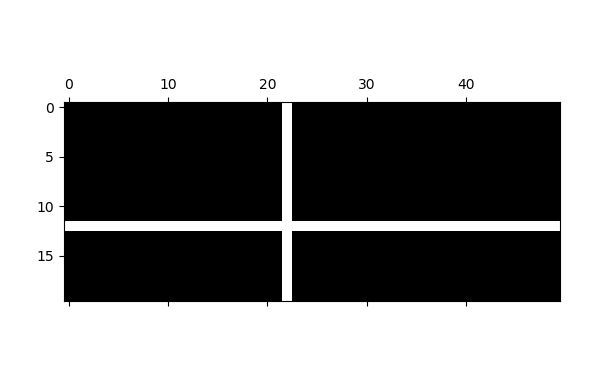
Example-1:
import matplotlib.pyplot as plt
import numpy as np
fig, ax1 = plt.subplots()
x = np.random.randn(20, 50)
x[12, :] = 0.
x[:, 22] = 0.
ax1.spy(x)
plt.show()
ax1.set_title('matplotlib.axes.Axes.spy() Example')
plt.show()
|
Output:
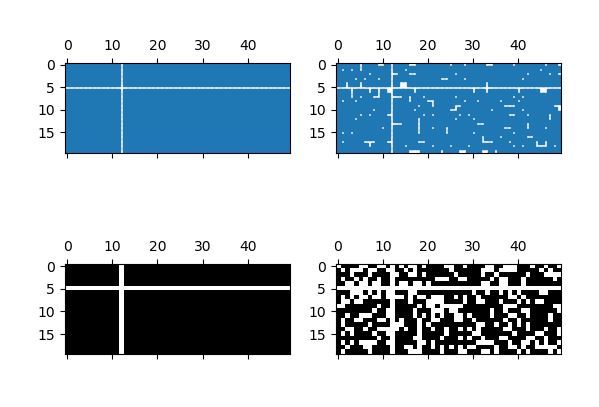
Example-2:
import matplotlib.pyplot as plt
import numpy as np
fig, [(ax1, ax2), (ax3, ax4)] = plt.subplots(2, 2)
x = np.random.randn(20, 50)
x[5, :] = 0.
x[:, 12] = 0.
ax1.spy(x, markersize = 4)
ax2.spy(x, precision = 0.2, markersize = 4)
ax3.spy(x)
ax4.spy(x, precision = 0.4)
plt.show()
ax1.set_title('matplotlib.axes.Axes.spy() Example')
plt.show()
|
Output:
Like Article
Suggest improvement
Share your thoughts in the comments
Please Login to comment...