With modern DevOps becoming more and more complex, monitoring and alerting stakeholders has become even more crucial for any microservice, and Prometheus is a tool to do the same. Prometheus is a completely open-sourced tool created to monitor highly dynamic container environments like Kubernetes, Docker Swarm, etc. However, it can also be used in a traditional non-container infrastructure where you have just bare servers with applications deployed directly on them. In this article, we will learn what prometheus is. We will see why Prometheus is so important in such infrastructure. And what are some of its use cases?
What is prometheus?
Prometheus is a tool created to monitor highly dynamic container environments like Kubernetes, Docker Swarm, etc.; however, it can also be used in a traditional non-container infrastructure where you have just bare servers with applications deployed directly on them. Prometheus provides a monitoring and alerting toolkit designed especially for microservices and containers. Over the past years, Prometheus has become the mainstream monitoring tool of choice in the container and microservice worlds. Prometheus is a Cloud Native Computing Foundation (CNCF) graduate project, that was released in July 2016.
Why Prometheus?
- Modern DevOps is becoming more and more complex to handle manually and therefore needs more automation. Typically, we have multiple servers that run our containerized applications, and there are hundreds of different processes running on that infrastructure. Here everything is interconnected, so maintaining such a setup to run smoothly and without application downtimes is very challenging. Imagine having such a complex infrastructure with loads of servers distributed over many locations and having no insight into what is happening on the hardware level or application level, like errors, response latency, hardware being down or overloaded, running out of resources, etc. In such complex infrastructure, more things can go wrong, When we have tons of services and applications deployed, any one of them can crash and cause the failure of other services, which only have so many moving pieces, and suddenly an application becomes unavailable to users, we must quickly identify exactly out of this hundred different things went wrong and that could be difficult and time-consuming if we start debugging the system manually.
- Let’s understand this with the help of specific examples, Let’s say that in our complex infrastructure, one specific server ran out of memory and kicked off a running container that was responsible for providing database sync between two database Pods in a Kubernetes cluster, that in turn caused those two database Pods to fail, that database was used by an authentication service that also stopped working because the database became unavailable and then application that depended on that authentication service couldn’t authenticate users. Meanwhile in the User Interface the user gets an error saying “Login Failed”. It is really tough to know what actually went wrong when you don’t have any insight of what is going on inside the cluster. The only option we have is to start working backwards from there to find the cause and fix it.
- A monitoring tool can not only make this searching the problem process more efficient by constantly monitoring whether services are running, it can also identify problems before they even occur and alerts the system administrators responsible for that infrastructure to prevent that issue. For example in this case Prometheus would check regularly the status of memory usage on each server and when on one of the servers it spikes over for 70% for over an hour or keeps increasing notify about the risk that the memory on that server might soon run out.
Prometheus Architecture
Prometheus Architecture at its core has the main component called Prometheus server that does the actual monitoring work and is made up of three parts:
- Time Series Database that stores all the metrics data like current CPU usage or number of exceptions in an application per second.
- Data Retrieval Worker that is responsible for getting or pulling those metrics from applications services, servers and other target resources and storing them or pushing them into that database.
- Web Server that accepts queries for that stored data and that web server component, or the Server API that is used to display the data in a dashboard or UI either through Prometheus Dashboard or some other data visualization tool like Grafana.

Key Terminologies
1. Targets
The Prometheus Server monitors a particular Target, and that Target could be anything like an entire Linux server or Windows server or standalone Apache server a single application or service like a database.
2. Metrics
Each target has units of monitoring, for example for a Linux Server as a Target, these units could be current CPU Status, its memory usage, Disk space usage etc. Similarly for an application it could be number of exceptions, number of requests, request duration etc. That unit for a specific target is called a metric. Metrics gets saved into the Prometheus Database component.
3. TYPE and HELP Attributes
Prometheus defines human readable text based format for this Metrics. Metrics entries or data has TYPE and HELP attributes to increase its readability. HELP is basically a description that describes what the metrics is about and TYPE is the type for metric.
4. Exporter
Exporter is basically a script or service that fetches Metrics from a Target and converts them in format the Prometheus understands and exposes this converted data at its own slash metrics endpoint where Prometheus can scrape them.
5. Alert Manager
Alert Manager is a Prometheus component that is responsible for firing Alerts via different channels like a slack channel or some other notification client. The Prometheus Server will then read the alert rules and if the condition in the rules is met an alert gets fired through that configured channel.
Tutorial – Deploying Prometheus Monitoring in Kubernetes Cluster
There are three ways to deploy Prometheus in a Kubernetes Cluster:
- Creating all configuration YAML files yourself and execute them in the right order
- Using an operator (which is like a manager of all Prometheus components)
- Using Helm chart to deploy operator
In this tutorial we will deploy Prometheus in a local Kubernetes Cluster using the third method which is using Helm chart to deploy the Prometheus Operator. This helm chart that is maintained by the helm community itself and is the most efficient and hassle free way of using Prometheus in any Cluster. In this demo, Helm will do the initial setup and Operator will then manage the running Prometheus setup.
Step 1: Creating a Kubernetes Cluster.
You can skip this step if you already have a Kubernetes Cluster running in your machine. But in case you don’t have a Cluster running enter the following command to create Kubernetes locally using Minikube:
minikube start
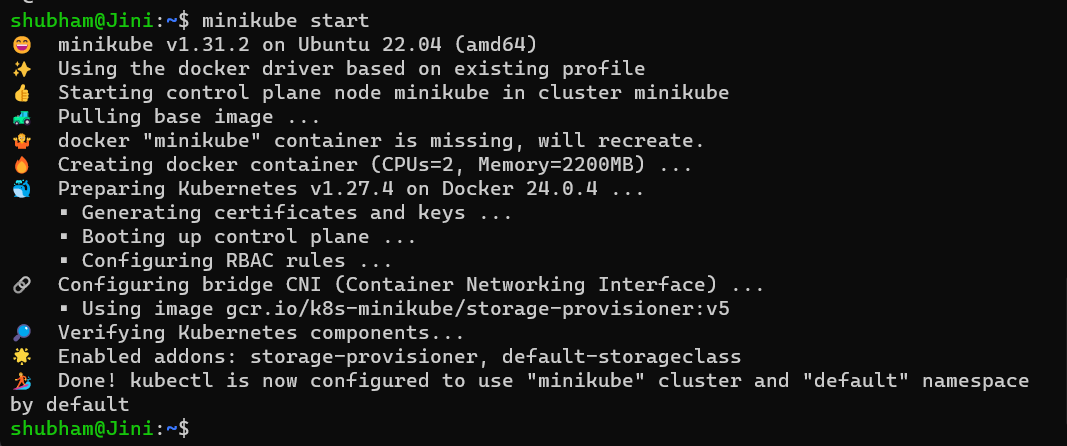
Minikube is a one-node Kubernetes cluster where master processes and work processes both run on one node.
Step 2: Installing Helm
You can install Helm if haven’t already. For Ubuntu, run the following script in order to
curl https://baltocdn.com/helm/signing.asc | gpg --dearmor | sudo tee /usr/share/keyrings/helm.gpg > /dev/null
sudo apt-get install apt-transport-https --yes
echo "deb [arch=$(dpkg --print-architecture) signed-by=/usr/share/keyrings/helm.gpg] https://baltocdn.com/helm/stable/debian/ all main" | sudo tee /etc/apt/sources.list.d/helm-stable-debian.list
sudo apt-get update
sudo apt-get install helm
Step 3: Adding the Prometheus repository
Let’s start with adding the Prometheus repository using by entering the following command:
helm repo add prometheus-community https://prometheus-community.github.io/helm-charts
and then update the repository by entering the following command:
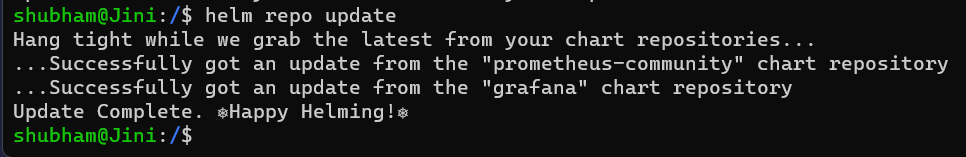
helm repo update
Following message with appear if the Prometheus repository is added via Helm and updated.
Step 4. Installing Prometheus
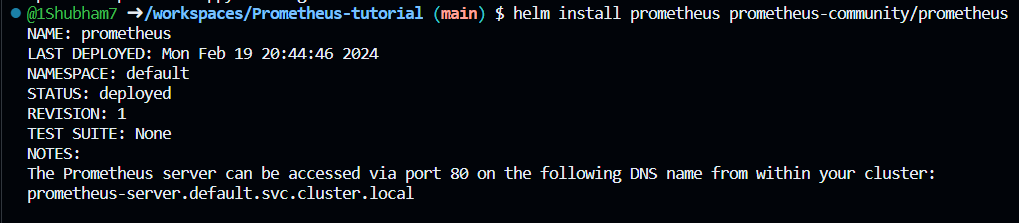
Enter the following command to install Prometheus using default values:
helm install prometheus prometheus-community/prometheus
You will get a similar output and Prometheus will be installed in the Cluster.
Step 5: Checking all the resources installed
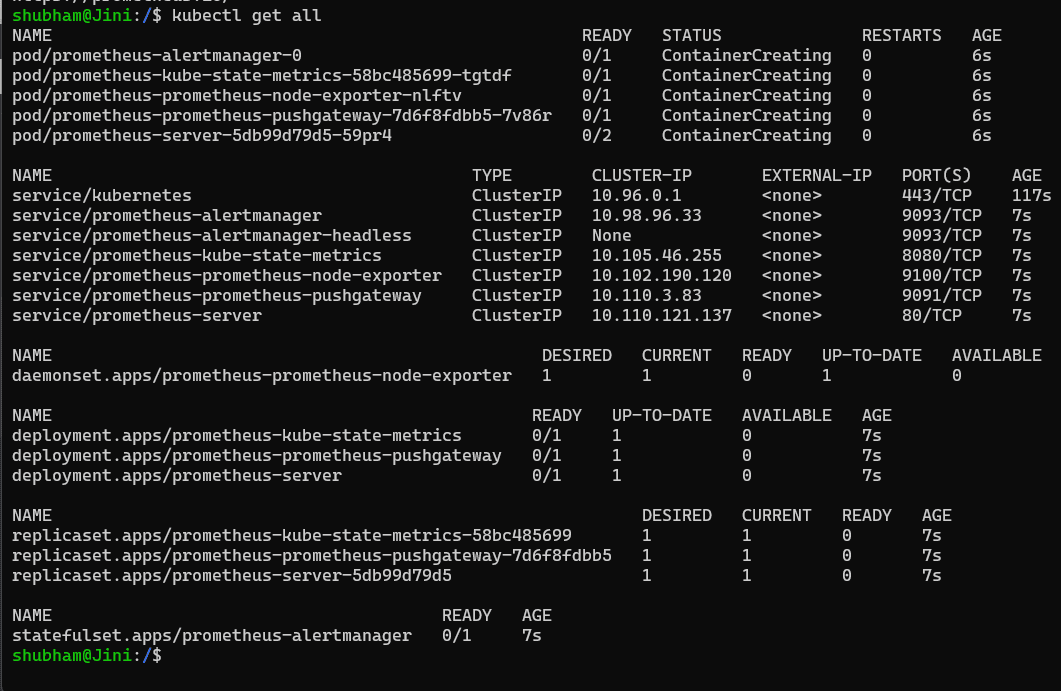
Now that Prometheus is installed in our cluster, we can check all the resources that were installed by the following command:
kubectl get all
and this will give you the list of all the deployed Kubernetes resources:
Step 6: Expose the “prometheus-server” Service
Now that Prometheus is installed in your cluster, we can you it to monitor our cluster. In order to open the Prometheus dashboard on our browser, we need to expose the “prometheus-server” Service since it is currently set as a ClusterIP.
kubectl expose service prometheus-server --type=NodePort --target-port=9090 --name=prometheus-server-ext
This will expose “prometheus-server” Service to port 9090. It check it in our browser, enter the following command, this command will generate the URL for our Prometheus application.
minikube service prometheus-server-ext
And you will get the following dashboard ready:
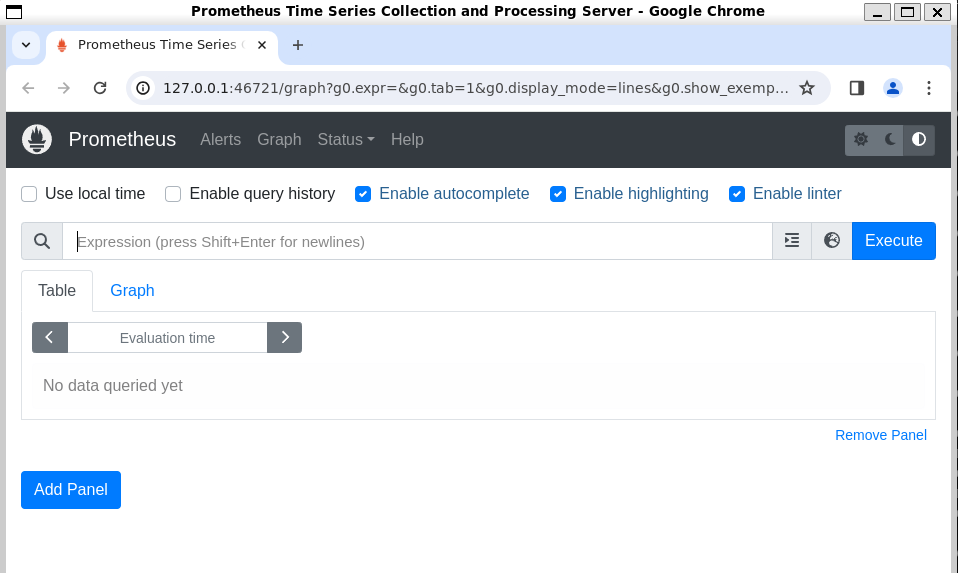
And with that we have successfully installed Prometheus on our local Kubernetes Cluster using Helm. Prometheus is running inside the cluster and we can access it using a browser/URL.
Advantages of Prometheus
Advantages of Prometheus compared to other Monitoring tools are listed as following:
- An important characteristic of Prometheus is that it is designed to be reliable even when other systems have an outage so that you can diagnose the problems and fix them.
- Each Prometheus server is standalone and self containing meaning it doesn’t depend on network storage or other remote services.
- Prometheus always works, even if other parts of the infrastructure are broken. You do not have to install agents, your Prometheus installation can already pull metrics.
- You do not need to set up extensive infrastructure to Prometheus Server.
- Prometheus is fully compatible with both Docker and Kubernetes and Prometheus components are available as Docker images and therefore can easily be deployed in Kubernetes or other container environments.
- It integrates great with Kubernetes infrastructure providing cluster node resource monitoring out of the box which means once it’s deployed on Kubernetes it starts gathering matrix data on each Kubernetes node server without any extra configuration.
Conclusion
Over the past years Prometheus has become the mainstream monitoring tool of choice in container and micro service world. Prometheus while is a tool created to monitor highly dynamic container environments like Kubernetes, Docker Swarm etc. it can also be used in a traditional non container infrastructure where you have just bare servers with applications deployed directly on them. Make sure to follow all the points we mentioned in the article and well as perform the tutorial yourself for better understanding of the tool.
Kubernetes Prometheus – FAQ’s
What does Prometheus Monitors?
The Prometheus Server monitors a particular Target, and that Target could be anything like an entire Linux server or Windows server or standalone Apache server a single application or service like a database.
What are the various attributes of a Metric?
Metrics entries or data has two attributes – TYPE and HELP . HELP is basically a description that describes what the metrics is about and TYPE is the type for metric.
Are there any down sights to Prometheus?
One disadvantage that Prometheus has is it that it can be difficult to scale when you have hundreds of servers you might want to have multiple Prometheus servers that somewhere aggregate all this metrics data and configuring that and scaling Prometheus in that way can be very difficult. So while using a Single Node is less complex and you can get started very easily, it puts a limit on the number of metrics that can be monitored by Prometheus.
Is Prometheus Open-sourced?
Yes, in fact Prometheus is 100% open source and community-driven project.
What is Prometheus Alert Manager
Alert Manager is a Prometheus component that is responsible for firing Alerts via different channels like a slack channel or some other notification client. The Prometheus Server will then read the alert rules and if the condition in the rules is met an alert gets fired through that configured channel.
Share your thoughts in the comments
Please Login to comment...