How To Use Prometheus To Monitor Docker Containerized Applications
Last Updated :
30 Jan, 2024
Containerization has transformed software development by providing portability and consistency through platforms like Docker. Yet ensuring the health of those containerized that containerized application require monitoring. Prometheus is a monitoring tool that uses its powerful features to monitor the application and make sure that the application is in good health. In this article first, you will understand what is Prometheus and then I will guide you through the steps to monitor your Docker container by using Prometheus.
What Is Prometheus?
Prometheus is an open source monitoring and alerting toolkit, which collects time series data from various sources allowing users to monitor and analyze metrics related to system performance. It also monitors the resource utilization and application location.
Steps To Use Prometheus To Monitor Docker Applications
Step 1: Install Prometheus on Ubuntu
wget https://github.com/prometheus/prometheus/releases/download/v2.48.1/prometheus-2.48.1.linux-amd64.tar.gz
tar xvfz prometheus-2.48.1.linux-amd64.tar.gz

If you are using windows then use these commands to install Prometheus .
curl -LO https://github.com/prometheus/prometheus/releases/download/v2.49.1/prometheus-2.49.1.windows-amd64.zip
unzip prometheus-2.49.1.windows-amd64.zip

Step 2 : Then you have to configure the daemon.json on Ubuntu . This will ensure docker daemon as a Prometheus target .
- In Ubuntu daemon.json is present in /etc/docker/ directory.
vi /etc/docker/daemon.json
{
   "metrics-addr": "0.0.0.0:9323",
   "experimental":true
}

- After editing the daemon.json you have to save and restart your docker service.
sudo service docker restart
- If you are using docker desktop on windows then you first have to open Docker desktop and then edit docker engine file .
  {
  "builder": {
    "gc": {
      "defaultKeepStorage": "20GB",
      "enabled": true
    }
  },
  "experimental": true,
  "metrics-addr": "0.0.0.0:9323"
}

Then you can save and restart the docker desktop .
Step 3 : Then you can visit this URL to see all the exposed metrics of your Docker service .
http://localhost:9323/metrics

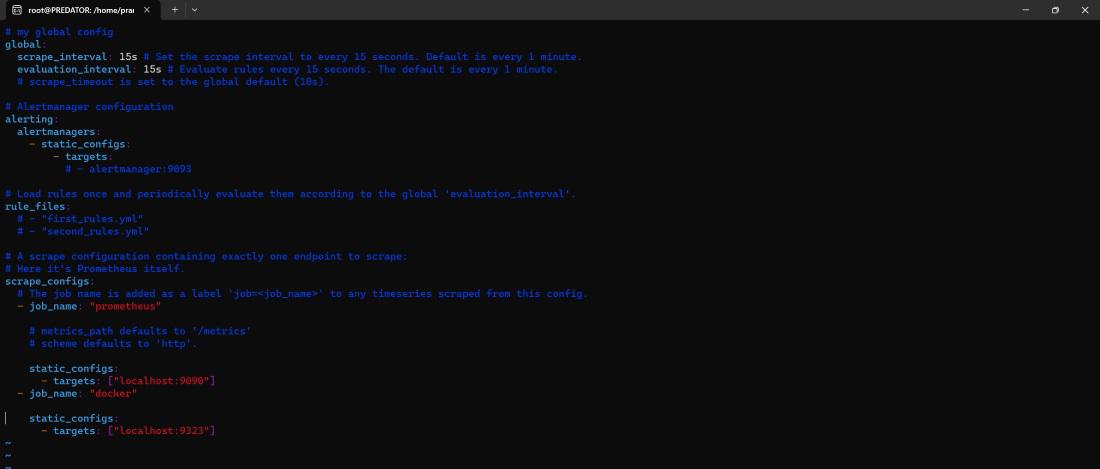
Step 4 : Edit the prometheus.yml to scrape all your container metrics from http://localhost:9323/metrics .
cd prometheus-2.48.1.linux-amd64
vi prometheus.yml
cd prometheus-2.49.1.windows-amd64
vi prometheus.yml

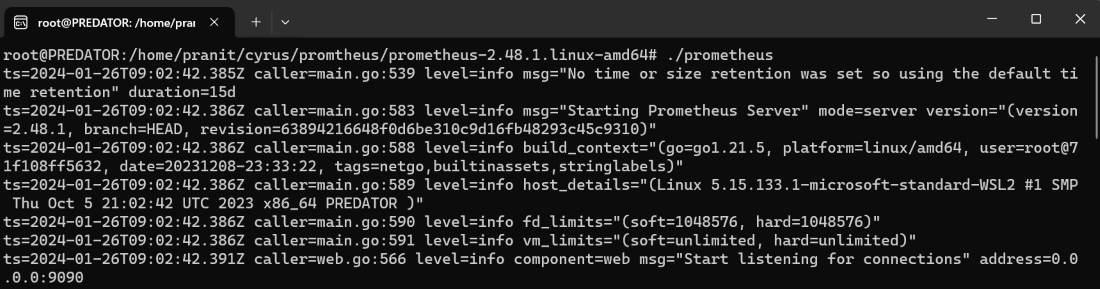
Step 5 : Now start the Prometheus server and connect it on .
./prometheus
./prometheus.exe

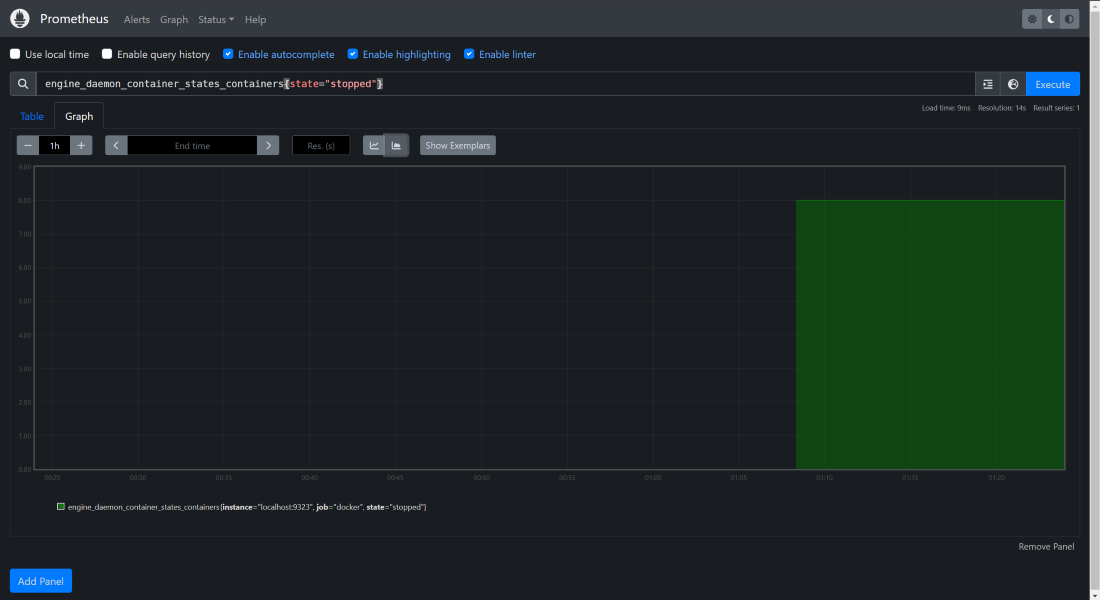
Step 6 : There are many metrics exposed in http://localhost:9323/metrics . You can choose any query and execute it on the Prometheus server .
For example , to see number of containers in stop state use this query “engine_daemon_container_states_containers{state=”stopped”}”
To know more about the Installation of Docker, Read this Articles.
Conclusion
You have first understood about what is Prometheus . Then you have then learned about how to install Prometheus and configure Prometheus to extract metrics from your Docker containers . At the end you have also executed a PromQL query to see number of containers in the stopped state . You have now successfully completed all the steps to use Prometheus to monitor docker containers .
Usage Of Prometheus For Monitor Docker Containers – FAQs
Why Monitoring Is Important ?
Monitoring is important because we can detect any issues at an early stage . Continuous monitoring provides insights into health and performance of the system, application which helps in ensuring that system is operating within acceptable parameters . It also helps in ensuring availability of services and system.
How To Monitor Docker Container Logs ?
Tools like Promtail can be used to collect container logs and froward them to Loki or other aggregation system , which then could be monitored .
What Visualization Tool Can Be Used With Prometheus To Monitor Docker Containers ?
Grafana is a user friendly interface which can be used to create dashboards and explore data collected by Prometheus .
What Is Importance Of Alerting In Prometheus ?
Alerting rules can be defined in Prometheus which evaluates the metric data and send notification through various channel like Slack ,Email, etc .
What Exporters That Can Be Integrated With Prometheus To Expose Metrics Of Docker Container?
Exporters like cAdvisor , Node Exporter , Docker exporter can be used to collect metrics related to Docker containers making them easily accessible to Prometheus .
Share your thoughts in the comments
Please Login to comment...