Inspect Tool in Microsoft Edge Browser
Last Updated :
30 Oct, 2023
The Inspect Tool in Microsoft Edge is a powerful web development feature that helps web developers troubleshoot and modify the structure, layout, and functionality of web pages, which includes HTML, CSS, and JavaScript code. This tool is an integrated part of the browser’s Developer Tools, which offers a range of features to help developers inspect, improve, and debug code for websites.
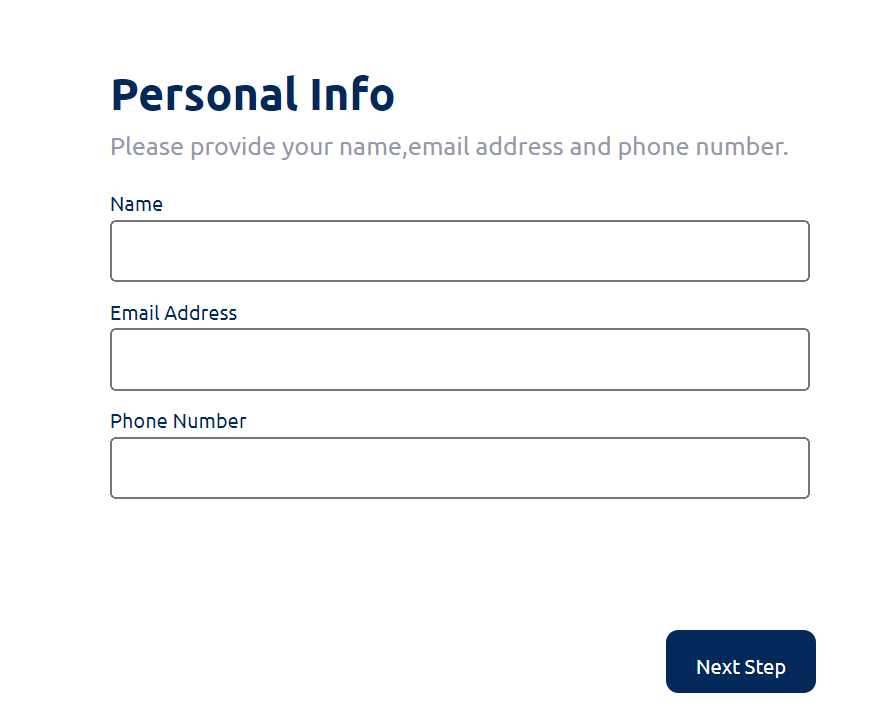
Step 1: Open the web page on the Edge you want to inspect
Step 2: Right-click or ‘Ctrl+Shift+I’ on the respective web page and choose the Inspect option

Step 3: Inspect elements: After clicking on the inspect option, A sidebar will appear that contains all the necessary options to edit and inspect the web page.
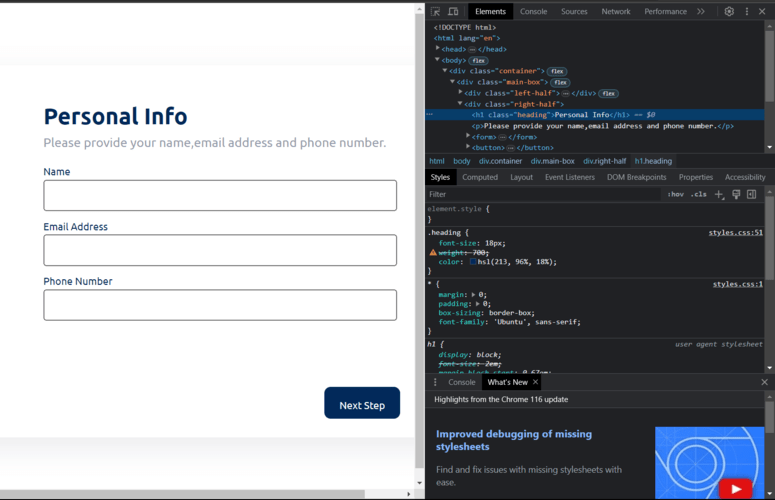
Step 1: After following the above steps, Go to the elements section on the top right. It will display all the HTML elements present on the web page.

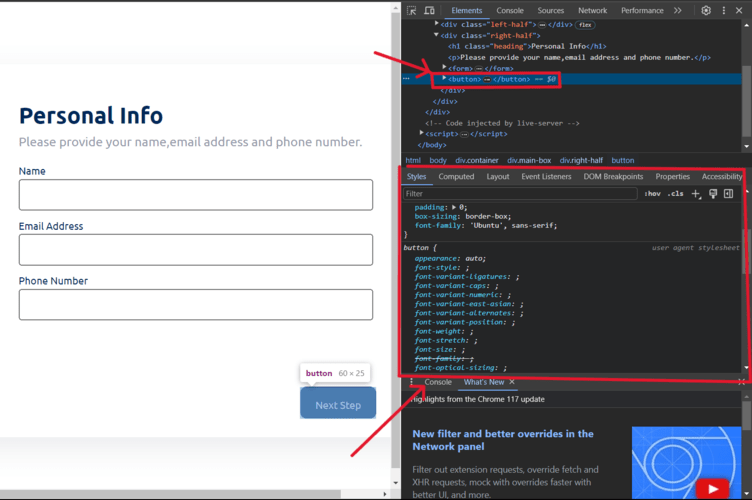
Step 2: Click on the element about which you want the information. All the information about the element will be displayed below it. For example, here I’m inspecting the details of the button element.
Inspecting the non-accessible elements
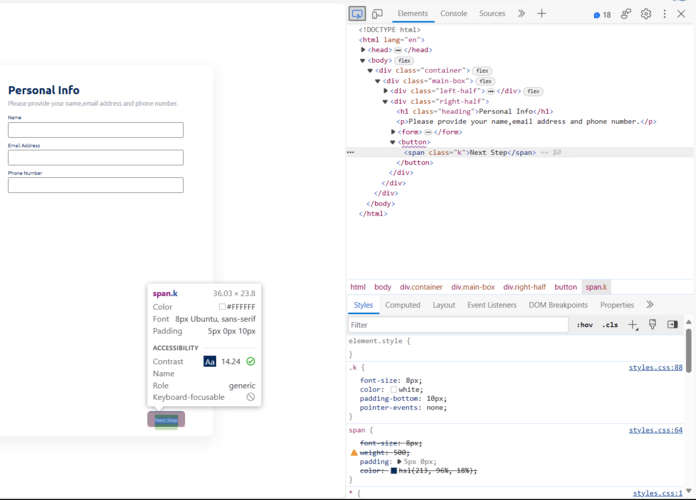
Elements whose attribute “point-events” is set to none (pointer-events: none) are not accessible, i.e., they can’t be inspected like other elements. To inspect them, follow the steps.
Step 1: Open the inspect tool
Step 2: Activate the tooltip
Step 3: Hover over the non-accessible element while pressing the “shift” key
For example: Here, we can’t access the content inside the button
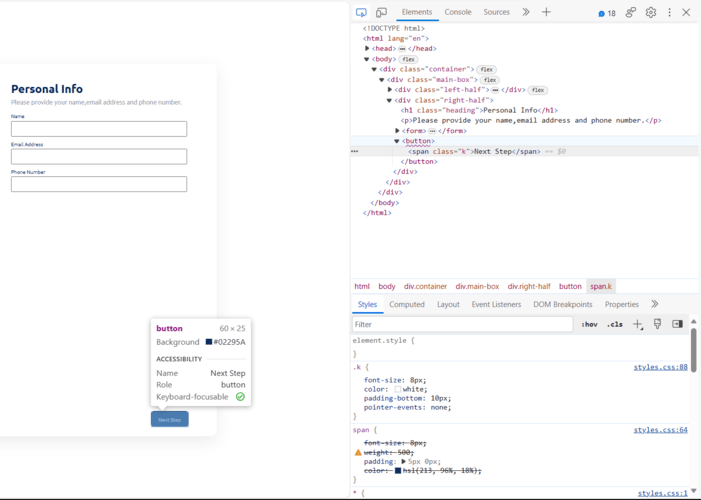
But after pressing “shift” key we can access it
Select any element and terminate the inspect mode.
Step 1: Open the Inspect tool
Step 2: Go to the element section, move the cursor over the element you want to select, and click on it
Step 3: Press the Escape key to terminate the inspect mode
.png)
Step 1: Open the inspect tool
Step 2: Press “ctrl+shift+c” or click on the tooltip icon. This will activate your tooltip
Step 3: Now hover over any part of your web page to see its information

Step 1: Open the inspect element tool
Step 2:Press and hold the “Ctrl” key on your keyboard. This will hide the inspect element tooltip
Step 3: Move the cursor over the element you want to inspect
Step 4: Release the “Ctrl” key to display the tooltip again
.gif)
Step 1: Open the Edge Inspection Tool
Step 2: Hover over the element you want to inspect
Step 3: Press and hold Ctrl+Alt (Windows/Linux) or Ctrl+Option (MacOS)
Step 4: Move the cursor around the webpage to inspect other elements
You can disable it by simply releasing the keys.

Conclusion
The Microsoft Edge Inspect tool is both powerful and versatile. It allows users to inspect and debug web pages effectively. With a wide range of features, such as viewing the DOM, CSS,CSS and JavaScript.
The Inspect tool is an essential tool for any web developer or tester. It solves a wide range of problems, spanning from simple CSS issues to complex memory leaks. If you haven’t already explored it, I suggest you try inspecting the tool today. By utilizing this powerful tool, you can effectively enhance the quality and performance of your web applications.
Share your thoughts in the comments
Please Login to comment...