How to Write Multiple Excel Files From Column Values – R programming
Last Updated :
09 Jan, 2023
A data frame is a cell-based structure comprising rows and columns belonging to the same or different data types. Each cell in the data frame is associated with a unique value, either a definite value or a missing value, indicated by NA. The data frame structure is in complete accordance with the Excel sheet structure. Therefore, the data frame values can be easily written into the Excel sheet, specified by the XLSX extension.
The XLSX package in R Programming Language can be used to perform read, write, and manipulation operations with Excel files. It is one of the most prominent packages available in all the varied environments to perform Excel document(xls and xlsx) formatting. It has to be downloaded and installed and downloaded into the working space using the command:
install.packages("xlsx")
Approach 1: Using the split() method
A data frame can be declared as containing the set of values using the in-built data.frame() method in R. The data frame may contain distinct or repetitive values in one or more columns. The split() method can be used to segregate the input data frame into multiple subsets of it depending on the values contained in the argument columns. The number of groups that are created depends on the number of distinct values obtained as a result of the application of the column condition. This method has the following syntax :
Syntax:
split ( dataframe , function)
Arguments :
- dataframe – The input data frame to be split
- function – The factor on the basis of which the data frame is to be divided.
The resultant data frames can then be subjected to the lapply() method iterating up to the number of data frames obtained. This method in R returns a list of the same length as that of the supplied data frame, each element of which is obtained as the result of applying FUN to the corresponding element of the input data frame.
Syntax:
lapply (X, FUN, …)
Arguments:
- X – an atomic vector or data frame to apply the function on
- FUN – the function to be applied over each element of X.
Each time an iteration over the subset data frame is performed. the contents of the data frame are written onto an xlsx sheet whose complete path is provided and concatenated with the corresponding distinct cell value of the input column in the split() method. The number of sheets created on the path is equivalent to the number of different grouped data frames created using the split() method.
The following code snippet uses the column col3 of the data frame and the number of sheets corresponds to the unique values of the column:
R
library(xlsx)
data_frame <- data.frame(col1=c(1:10),
col2=c("Anna","Mindy","Bindy",
"Tindy","Ron",
"Charles","Zoe","Dan",
"Lincoln","Burrows"),
col3=c("CS","CA","Eco","Eco","CA",
"Eco","CS","CS","CS","Eco"))
data_mod <- split(data_frame, data_frame$col3)
print("Segregated dataframes")
print(data_mod)
|
Output :
[1] "Segregated dataframes"
$CA
col1  col2 col3
2    2 Mindy   CA
5    5   Ron   CA
$CS
col1    col2 col3
1    1    Anna   CS
7    7     Zoe   CS
8    8     Dan   CS
9    9 Lincoln   CS
$Eco
 col1    col2 col3
3     3   Bindy  Eco
4     4   Tindy  Eco
6     6 Charles  Eco
10   10 Burrows  Eco
Now, let’s create the XLSX files iteratively.
R
size <- length(data_mod)
lapply(1:size,
function(i)
write.xlsx(data_mod[[i]],
file = paste0("/Users/mallikagupta/Desktop/",
names(data_mod[i]), ".xlsx")))
|
Output:
[[1]]
NULL

[[2]]
NULL

[[3]]
NULL
Explanation:
Since there are three distinct groups belonging to the col3 of the data_frame, therefore, three different excel sheets are created at the specified path location, with the name corresponding to the distinct col3 value of that particular group. The entire rows of the input data frame are copied to the particular excel sheet that is specified.
Excel files created by using the data frame
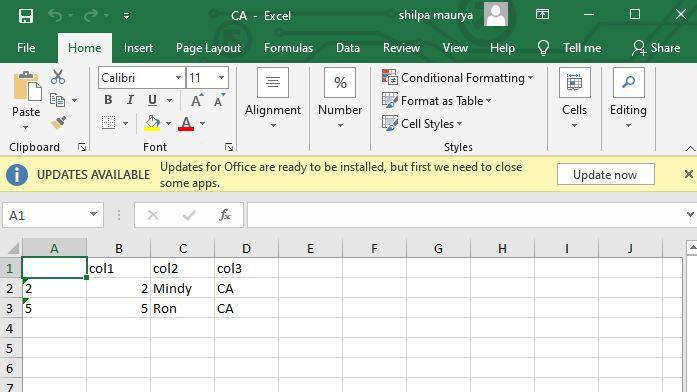
Excel files with CA value as col3
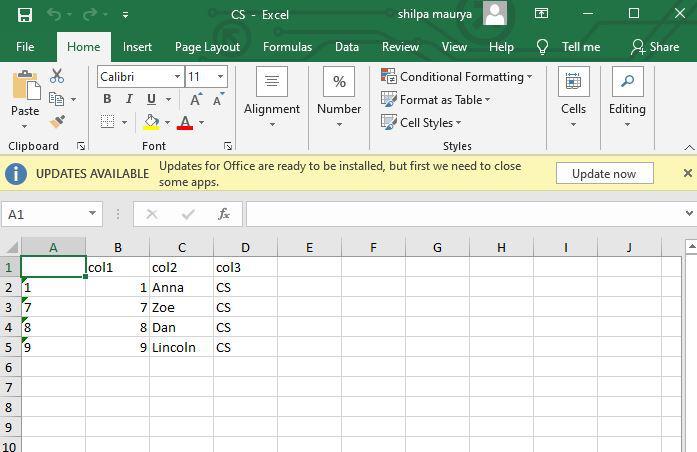
Excel files with CS value as col3
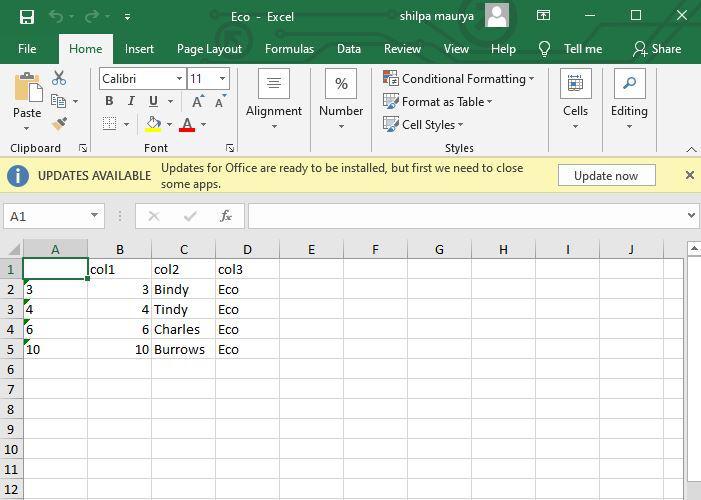
Excel files with Eco value as col3
Approach 2: Using the group_split() method
The group_split() method can also be used to divide the input data frame into multiple subsets based on the columns used as arguments. Columns or logical conditions can also be specified as the argument of this method. The method can also be supplied using the piping operator to the data frame.
Syntax:
group_split ( dataframe , function)
Arguments :
- dataframe – The input data frame to be split
- function – The factor on the basis of which the data frame is to be divided.
In the following code snippet, a condition is applied over column col4 in the input data frame. The condition checks if the value of col4 is greater than 2. Based on the boolean TRUE or FALSE value, two groups are made. Therefore, two excel files are created, one with a col4 value <=2 and the other with a col4 value >2 respectively.
R
library("xlsx")
library("dplyr")
data_frame <- data.frame(col1 = c(1:10),
col2=c("Anna","Mindy","Bindy",
"Tindy","Ron",
"Charles","Zoe","Dan",
"Lincoln","Burrows"),
col3=c("CS","CA","Eco","Eco","CA",
"Eco","CS","CS","CS","Eco"),
col4=c(1,3,2,2,3,4,1,4,1,2))
data_mod <- data_frame %>%
group_split(col4>2)
print("Segregated data frames")
print(data_mod)
|
Output:
[1] "Segregated data frames"
<list_of<
tbl_df<
  col1    : integer
  col2    : character
  col3    : character
  col4    : double
  col4 > 2: logical
>[2]>
[[1]]
# A tibble: 6 × 5
 col1 col2    col3   col4 `col4 > 2`
<int> <chr>   <chr> <dbl> <lgl>
1     1 Anna    CS        1 FALSE
2     3 Bindy   Eco       2 FALSE
3     4 Tindy   Eco       2 FALSE
4     7 Zoe     CS        1 FALSE
5     9 Lincoln CS        1 FALSE
6    10 Burrows Eco       2 FALSE
[[2]]
# A tibble: 4 × 5
 col1 col2    col3   col4 `col4 > 2`
<int> <chr>   <chr> <dbl> <lgl>
1     2 Mindy   CA        3 TRUE
2     5 Ron     CA        3 TRUE
3     6 Charles Eco       4 TRUE
4     8 Dan     CS        4 TRUE
R
size <- length(data_mod)
lapply(1:size,
function(i)
write.xlsx(data_mod[[i]],
file = paste0("/Users/mallikagupta/Desktop/new_",
i, ".xlsx")))
|
Output :
[[1]]
NULL

[[2]]
NULL
Explanation :
The last column in the returned set of Tibbles is created with the header “col4>2”, and it points to two types of values, a logical TRUE and a FALSE value respectively. The col4 value is validated each time and then the entire row is copied onto the respective table.
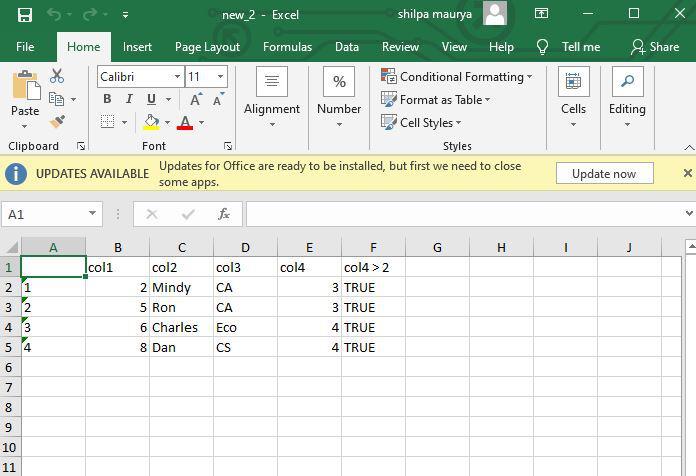
Excel files with 3, and 4 values as col4
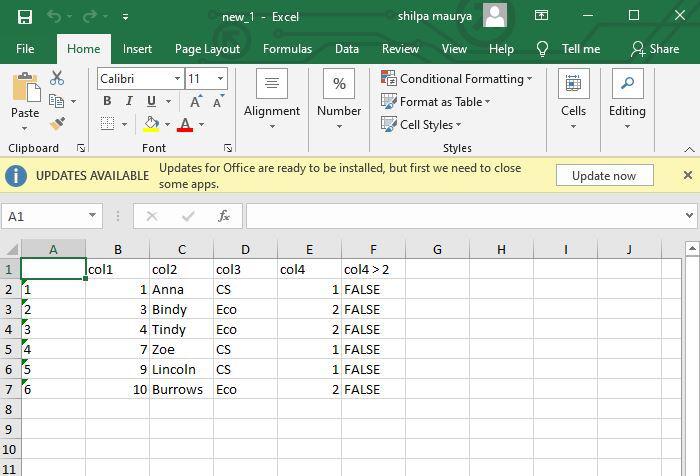
Excel files with 1, 2 values as col4
Share your thoughts in the comments
Please Login to comment...