How to Use Stargazer Package in R
Last Updated :
01 Mar, 2024
Stargazer is a popular R package designed to create summary tables for statistical models in R. It provides an easy-to-use interface to generate high-quality HTML, LaTeX, and ASCII text tables, which are commonly used in academic research, reports, and presentations. Whether working with linear regression models, generalized linear models, or other types of statistical models, Stargazer simplifies the process of presenting the results effectively.
What is the Stargazer Package?
The Stargazer package in R Programming Language is a powerful tool for creating summary tables of statistical models. These tables are commonly used in research papers, reports, and presentations to present model coefficients, standard errors, significance levels, and other relevant statistics in a concise and readable format. Stargazer simplifies the process of generating these tables by providing a user-friendly interface and allowing for extensive customization.
The stargazer function is typically used to create two different types of tables
- A table that explains summary statistics for each variable in a data frame
- Another table that summarizes the results of a regression model
Syntax
stargazer(df, type=’text’, title=’my_title’, out=’my_data.txt’, …)
where,
- df: Variable representing the data frame to utilize
- type: Format of output to exhibit
- title: Heading to display atop the table
- out: Designation for the file when exporting the table
Key Features of Stargazer Package in R
- Summary Tables: Easily create summary tables for statistical models like linear regression.
- Customization: Customize table titles, column labels, model labels, and more for personalized tables.
- Output Formats: Generate tables in various formats such as HTML, LaTeX, and plain text.
- Ease of Use: Simple syntax makes it beginner-friendly for presenting model results effectively.
- Professional Presentation: Enhance the clarity and professionalism of your statistical analyses with neat tables.
Load Package and Read the Dataset
R
install.packages("stargazer")
library(stargazer)
data(mtcars)
head(mtcars)
|
Output:
                   mpg cyl disp  hp drat    wt  qsec vs am gear carb
Mazda RX4         21.0   6  160 110 3.90 2.620 16.46  0  1    4    4
Mazda RX4 Wag     21.0   6  160 110 3.90 2.875 17.02  0  1    4    4
Datsun 710        22.8   4  108  93 3.85 2.320 18.61  1  1    4    1
Hornet 4 Drive    21.4   6  258 110 3.08 3.215 19.44  1  0    3    1
Hornet Sportabout 18.7   8  360 175 3.15 3.440 17.02  0  0    3    2
Valiant           18.1   6  225 105 2.76 3.460 20.22  1  0    3    1
Check the Summary
Output:
      mpg             cyl             disp             hp
 Min.   :10.40   Min.   :4.000   Min.   : 71.1   Min.   : 52.0
 1st Qu.:15.43   1st Qu.:4.000   1st Qu.:120.8   1st Qu.: 96.5
 Median :19.20   Median :6.000   Median :196.3   Median :123.0
 Mean   :20.09   Mean   :6.188   Mean   :230.7   Mean   :146.7
 3rd Qu.:22.80   3rd Qu.:8.000   3rd Qu.:326.0   3rd Qu.:180.0
 Max.   :33.90   Max.   :8.000   Max.   :472.0   Max.   :335.0
      drat             wt             qsec             vs
 Min.   :2.760   Min.   :1.513   Min.   :14.50   Min.   :0.0000
 1st Qu.:3.080   1st Qu.:2.581   1st Qu.:16.89   1st Qu.:0.0000
 Median :3.695   Median :3.325   Median :17.71   Median :0.0000
 Mean   :3.597   Mean   :3.217   Mean   :17.85   Mean   :0.4375
 3rd Qu.:3.920   3rd Qu.:3.610   3rd Qu.:18.90   3rd Qu.:1.0000
 Max.   :4.930   Max.   :5.424   Max.   :22.90   Max.   :1.0000
       am              gear            carb
 Min.   :0.0000   Min.   :3.000   Min.   :1.000
 1st Qu.:0.0000   1st Qu.:3.000   1st Qu.:2.000
 Median :0.0000   Median :4.000   Median :2.000
 Mean   :0.4062   Mean   :3.688   Mean   :2.812
 3rd Qu.:1.0000   3rd Qu.:4.000   3rd Qu.:4.000
 Max.   :1.0000   Max.   :5.000   Max.   :8.000
Create Summary Statistics Table Using Stargazer
R
stargazer(mtcars, type='text', title='Summary Statistics')
|
Output:
Summary Statistics
============================================
Statistic N   Mean   St. Dev.  Min     Max
--------------------------------------------
mpg       32 20.091   6.027   10.400 33.900
cyl       32  6.188   1.786     4       8
disp      32 230.722 123.939  71.100 472.000
hp        32 146.688  68.563    52     335
drat      32  3.597   0.535   2.760   4.930
wt        32  3.217   0.978   1.513   5.424
qsec      32 17.849   1.787   14.500 22.900
vs        32  0.438   0.504     0       1
am        32  0.406   0.499     0       1
gear      32  3.688   0.738     3       5
carb      32  2.812   1.615     1       8
--------------------------------------------
type specifies that the output format of the table should be text. title sets the title of the table as “Custom Summary Statistics”.
Fit a Regression Model and exported to the specified file paths
R
fit <- lm(mpg ~ wt + cyl, data = mtcars)
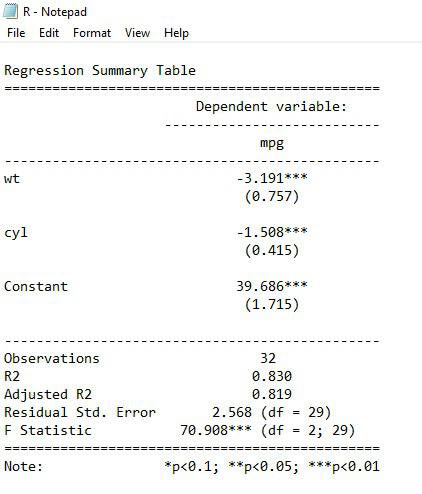
stargazer(fit, type = 'text', title = 'Regression Summary Table',
out = 'C:\\Users\\GFG19565\\Downloads\\R.txt')
|
Output:
Regression Summary Table
===============================================
                        Dependent variable:
                    ---------------------------
                                mpg
-----------------------------------------------
wt                           -3.191***
                              (0.757)

cyl                          -1.508***
                              (0.415)

Constant                     39.686***
                              (1.715)

-----------------------------------------------
Observations                    32
R2                             0.830
Adjusted R2                    0.819
Residual Std. Error       2.568 (df = 29)
F Statistic           70.908*** (df = 2; 29)
===============================================
Note:               *p<0.1; **p<0.05; ***p<0.01
lm() function is used to fit a linear regression model. In this case, the dependent variable mpg (miles per gallon) is regressed on the independent variables wt (weight) and cyl (number of cylinders).
- Formula mpg ~ wt + cyl indicates that we are modeling the relationship between mpg and the predictors wt and cyl.
- The data = mtcars argument specifies that the data for the regression model is taken from the mtcars dataset.
The output displays the coefficients for each term in the regression model along with various summary statistics near the bottom of the table.
Checking the Exported Table
Now verify if the summary statistics table and the Regression summary table were successfully exported to the specified file paths.

Stargazer Package in R
We can see the file is exported to the specified file paths and when we cliq on this file we get data in text format that we have pass.
Stargazer Package in R
Summary tables Vs Stargazer Package tables
|
Aspect
|
Summary Tables
|
Stargazer Package Tables
|
|
Presentation
|
Basic statistical summaries in plain format
|
Professionally formatted, resembling academic papers
|
|
Customization
|
Limited options for basic formatting adjustments
|
Extensive customization options for titles, labels, etc.
|
|
Output Formats
|
Typically limited to plain text or basic formatting
|
Supports HTML, LaTeX, plain text, with various options
|
|
Integration with Tools
|
May require additional manual steps for integration
|
Seamless integration with tools like R Markdown
|
|
Aesthetics
|
Basic appearance, often lacking visual appeal
|
Neat and visually appealing, suitable for publications
|
Advantages of Stargazer package
- Simplifies creation of publication-quality tables for statistical models.
- Offers extensive customization options for table appearance.
- Supports various output formats including HTML, LaTeX, and plain text.
- Provides straightforward syntax, making it easy to use for beginners.
- Enhances professional presentation of statistical findings.
Disadvantages of Stargazer package
- Limited support for non-linear models.
- May require additional packages for advanced customization.
- Learning curve for customization beyond basic usage.
- Dependency on R environment for usage.
- Requires careful handling of large datasets to avoid performance issues.
Conclusion
The Stargazer package in R is a versatile and user-friendly tool for creating summary tables of statistical models. With its easy-to-use interface and various customization options, Stargazer simplifies the process of presenting model results effectively. Stargazer helps enhance the clarity and professionalism of our statistical analyses by generating neat and professional-looking tables in various formats.
Share your thoughts in the comments
Please Login to comment...