How to save multiple html widgets together in R
Last Updated :
12 Sep, 2023
HTML widgets in R are powerful tools that enable the creation of interactive graphical elements and visualizations within R-based web applications. By leveraging HTML, CSS, and JavaScript, these widgets allow users to develop dynamic content seamlessly integrated with their R code.
HTML widgets in R are typically implemented as dedicated R packages, serving as bridges between R and JavaScript libraries responsible for rendering interactive visualizations. These packages offer pre-built widgets or functions capable of generating the required HTML, CSS, and JavaScript code to create diverse interactive elements.
some of the popular HTML widget packages that are available in the R ecosystem are Plotly, Leaflet, DT, Shinydashboard, and networkD3.
Packages Used:
htmlwidgets:
It provides a framework to create HTML widgets within the R environment, it acts as a bridge between R and javascript, which allows us to make use of the javascript libraries for data visualization and interactivity within the R environment, by providing the consistent API and the set of conventions it simplifies the process of creating the HTML widgets within R.
Plotly:
plotly is a javascript graphing library that allows users to create interactive and visually appealing data visualizations, a wide range of chart types, scatterplots, bar charts, line charts, pie charts and much more supported by the plot. The `Plotly` package leverages the `htmlwidgets` package to convert the Plotly object into an interactive HTML widget. This integration allows R users to create complex and interactive plots using Plotly’s features while remaining within the R environment.
leaflet:
It is a popular open-source javascript library for creating interactive maps. a lightweight and versatile solution provided by the leaflet for displaying graphical data on web pages.
key features:
map creation, marker and popup, Layers and Overlays, Interactivity and Events, Plugins and Extensions.
htmltools:
The “htmltools” package is widely used in R for working with HTML content, especially when developing HTML-based widgets for interactive web applications and custom visualizations. This package provides a range of functions and utilities that facilitate the generation of HTML tags, manipulation of HTML structures, and embedding of R code within HTML documents.
By leveraging the capabilities of the “htmltools” package, developers can create dynamic and interactive HTML widgets in R. These widgets can be seamlessly integrated into web pages or utilized within various applications.
HTML structures can be created using the functions like tags$div(),tags$p(),tags$ul() and much more
HTML structures can be combined using tagList() ‘which we had used below in our example’ or tagAppendChild()
Then it can be rendered using html_print()
To save multiple HTML widgets together in R, you can utilize the htmlwidgets package. This package offers functionalities to combine and save multiple widgets into a single HTML file. Below is a step-by-step guide on accomplishing this:
1. Begin by installing and loading the necessary packages:
Approach:
1. To install packages R offers a method install.packages(“package_name”)
2. Then load “htmlwidgets” package with the method library(package_name)
Example:
R
#To install package
install.packages(“htmlwidgets”)
#To include package from the library
library(htmlwidgets)
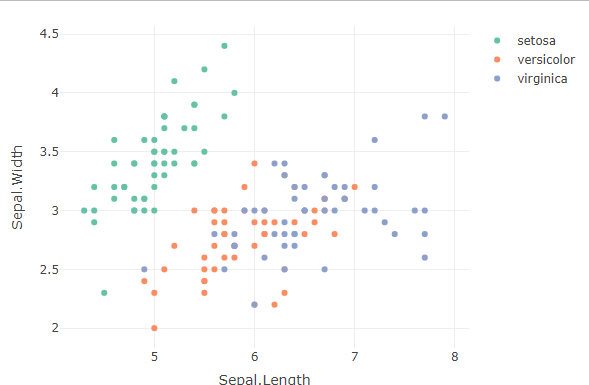
2. Let us create our first widget and name that First_widget (This widget is made up of Plotly package)
Approach:
1. Load the “plotly” package with the library( ) method.
The “plotly” package in R can be loaded using the library(plotly) command. It is a widely-used package for creating interactive and dynamic visualizations. By loading “plotly,” you gain access to a range of functions and tools for building interactive plots, charts, and graphs directly in R. The package utilizes the “plotly.js” library and offers features like zooming, panning, tooltips, and exporting to different formats. With “plotly,” you can create visually appealing and interactive plots by specifying data and customizing their appearance and behavior.
2.Then create first_widget using plot_ly( ) method.
To create your first widget using the plot_ly() function from the “plotly” package in R, begin by loading the package with the library(plotly). With the package loaded, you can use plot_ly() to generate interactive plots and charts. This function allows you to specify data and customize the aesthetics of your plot, including plot type, colors, markers, and axis labels. These widgets can be seamlessly integrated into web pages or used in interactive applications, providing a dynamic and interactive user experience.
Example:
R
#Create your desired widget
#Here I used plotly
library(plotly)
First_Widget <- plot_ly(data = iris, x = ~Sepal.Length,
y = ~Sepal.Width, color = ~Species,
type = “scatter”, mode = “markers”)
First_Widget
Output:
3.Let we create our second widget and name that as Second_widget (This widget is made up of leaflet package)
Approach:
1. Load “Leaflet” package with the library( ) method.
To load the “Leaflet” package in R, simply use the library(leaflet) command. This package is widely used for creating interactive maps in R. By loading “Leaflet,” you gain access to a range of functions and tools for generating interactive and customizable maps directly within R. You can add various map layers, markers, polygons, and other elements to your maps, and customize their appearance and interactivity.
2.Then create Second_widget using leaflet( ) method and addTiles( ) method offered by the Leaflet.
To create your second widget using the Leaflet package in R, start by loading the package using library(leaflet). Once the package is loaded, you can use the “leaflet()” function to initialize a leaflet map object. Then, you can utilize the “addTiles()” method to add the default tile layer to your map. This combination allows you to create an interactive map with the default tile layer as a starting point. To enhance the map, you have the flexibility to customize it further by adding additional layers, markers, or interactive elements. By doing so, you can create an engaging and visually informative interactive map that can be explored seamlessly within your R environment.
Example:
R
library(leaflet)
Second_widget <- leaflet() %>%
addTiles() %>%
addMarkers(lng = 77.39897061534452,lat = 28.50500697793393,
popup = “GFG ,Noida,UP”)
Second_widget
Output:

4. save each of the widgets as an independent html file with the help of the saveWidget( ) method
Approach:
1.Use saveWidget(widget , file=file_name.html) to save your widget as the html file.
To save your widget as an HTML file in R, you can utilize the saveWidget() function. This function takes your widget object as input and allows you to specify a file name with the “.html” extension for saving. By using saveWidget(), you can generate an HTML file that encapsulates your widget. This file can be shared with others or embedded into web pages for easy access and viewing. With the ability to save your widget as an HTML file, you can conveniently distribute and showcase your interactive widget to a wider audience.
2.The saveWidget() method is offered by the “htmlwidgets” package.
Example:
R
# load library
library(htmlwidgets)
#saving each widget as a separate html file
saveWidget(First_Widget, file = “First_widget.html”)
saveWidget(Second_widget, file = “Second_widget.html”)
5. Combine the contents in each of those widgets With the help of the “htmltools” into one tagList by tagList( )
function and save that as an HTML file which is the final combined HTML widgets file.
Approach:
1. Load “htmltools” package with the library( ) method.
2.This utilizes the R package “htmltools” for generating HTML content list by reading the contents of the two separate HTML files(First_widget.html and Second_widget.html).
readlines() method is used to read the contents of the HTML files
readLines(con , n = -1, ok = TRUE, warn = TRUE,encoding = “unknown”)
con: This parameter indicates the source from which the lines should be read. It can be a file path represented as a string or a connection object obtained from functions like “file() or gzfile()”.
n: This optional parameter determines the number of lines to read. The default value is -1, which means that all lines will be read. If you want to read a specific number of lines, you can provide the desired value.
ok: This optional parameter controls whether the function should continue reading lines if an error occurs. By default, it is set to TRUE, allowing the function to continue reading even in the presence of errors. Setting it to FALSE will halt the reading process upon encountering an error.
warn: This optional parameter manages whether a warning should be issued when an incomplete final line is encountered. The default value is TRUE, resulting in a warning being issued. To suppress the warning, you can set it to FALSE.
encoding: This optional parameter specifies the character encoding of the file. The default value is “unknown”, which triggers an automatic detection of the encoding. If you need to specify a particular encoding, you can provide it as a value for this parameter.
3.The these HTML documents are combined into a single document with the use of the ‘tagList( )’ method.
“tagList(tag1,tag2,……….)”
4.Finally the result HTML content is saved as a “finalcomb_widgets.html” with the use of “save_html( )” method.
Example:
R
library(htmltools)
html_content <- list(
HTML(readLines(“First_widget.html”)),
HTML(readLines(“Second_Widget.html”))
)
finalcomb_html <- tagList(html_content)
save_html(finalcomb_html, file = “finalcomb_widgets.html”)
Output:
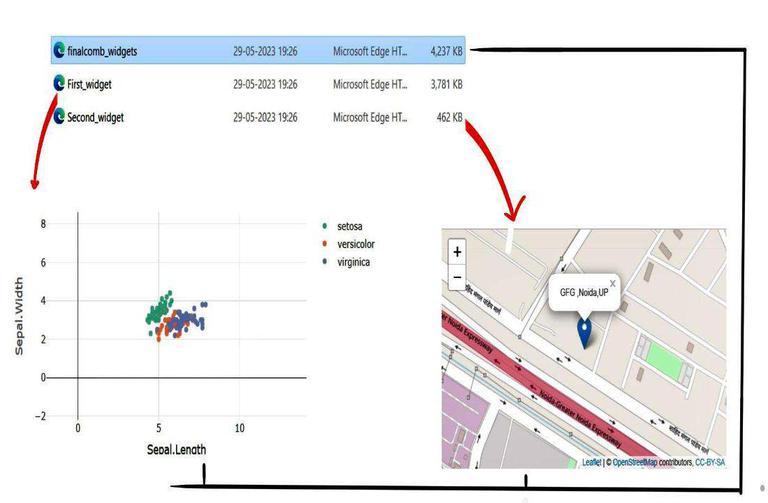
To access the created wigets:
- Click the session in the top pannel of the R studio
- Then click set working directory
- Then Choose directory
- Then Choose your desired location where your widgets need to be stored
Example:
.png)
Share your thoughts in the comments
Please Login to comment...