How to rotate only text in annotation in ggplot2?
Last Updated :
03 Mar, 2021
R has ggplot2 which is a data visualization package for the statistical programming language R. After analyzing and plotting graphs, we can add an annotation in our graph by annotate() function.
Syntax: annotate()
Parameters:
- geom : specify text
- x : x axis location
- y : y axis location
- label : custom textual content
- color : color of textual content
- size : size of text
- fontface : fontface of text
- angle : angle of text
Approach
- Import module
- Create dataframe
- Plot graph
- Use annotate() function with required parameters
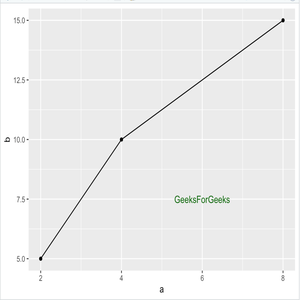
First, let’s create a simple line plot.
Program:
R
library(ggplot2)
df <- data.frame(a=c(2,4,8),
b=c(5, 10, 15))
plot = ggplot(df, aes(x = a, y = b)) + geom_point() + geom_line()
plot + annotate('text', x = 6, y = 10,
label = 'GeeksForGeeks',
size = 10,
angle='90')
|
Output:
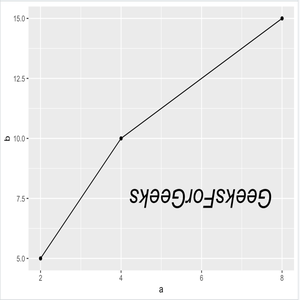
We can rotate text in annotation by angle parameter. To modify the angle of text, an “angle” argument is used. In the below example, the angle assigned to the text “GeeksForGeeks” is 180.
To change the font face of text, use fontface argument and assign one type of font face like bold, Italic, etc. Here, an italic font-face is assigned to the text.
Program :
R
library(ggplot2)
df <- data.frame(a=c(2,4,8),
b=c(5, 10, 15))
plot = ggplot(df, aes(x = a, y = b)) + geom_point() + geom_line()
plot + annotate('text', x = 6, y = 7.5,
label = 'GeeksForGeeks',
size = 10,
fontface='bold',
angle='180')
|
Output:
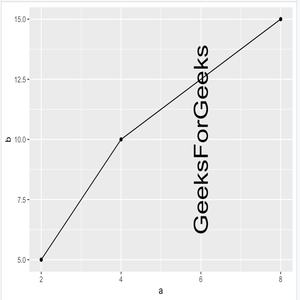
Example 2:
R
library(ggplot2)
df <- data.frame(a=c(2,4,8),
b=c(5, 10, 15))
myplot = ggplot(df, aes(x = a, y = b)) + geom_point() + geom_line()
myplot + annotate('text', x = 6, y = 10,
label = 'GeeksForGeeks',
size = 10,
angle='90')
|
Output:
Share your thoughts in the comments
Please Login to comment...