Change the Background color of ggplot2 Text Label Annotation in R
Last Updated :
17 Jun, 2021
In this article, we will be looking at the approach to change the background color of ggplot2 text label Annotation in the R programming language.
This can be done using the geom_label() function using its fill argument. The user needs to first install and import the ggplot2 package in the R console, and then call the goem_label() function to add the label in the label argument and fill argument of this function to add the background color the created labels in the R programming language.
This function text geoms are useful for labeling plots. They can be used by themselves as scatterplots or in combination with other geoms.
Syntax:
geom_label(mapping = NULL,data = NULL, stat = “identity”, position = “identity”, …, parse = FALSE, nudge_x = 0, nudge_y = 0, label.padding = unit(0.25, “lines”), label.r = unit(0.15, “lines”), label.size = 0.25, na.rm = FALSE, show.legend = NA, inherit.aes = TRUE)
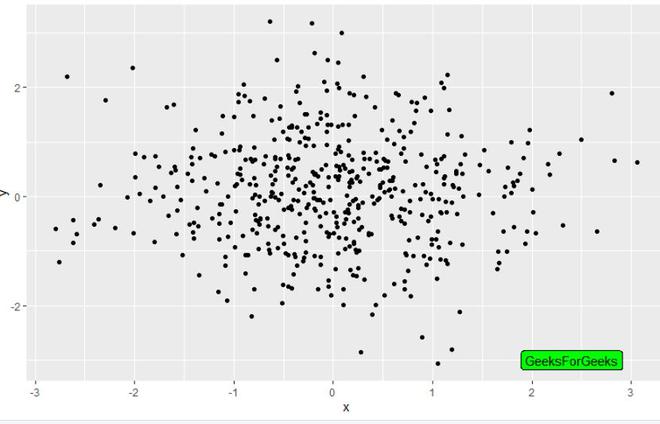
Example1:
R
library("ggplot2")
gfg_data=data.frame(x=rnorm(500),y=rnorm(500))
gfg_plot <- ggplot(gfg_data, aes(x, y)) + geom_point()
gfg_plot+geom_label(aes(x = 2.4, y = -3,label = "GeeksForGeeks"),
fill = "green")
|
Output:
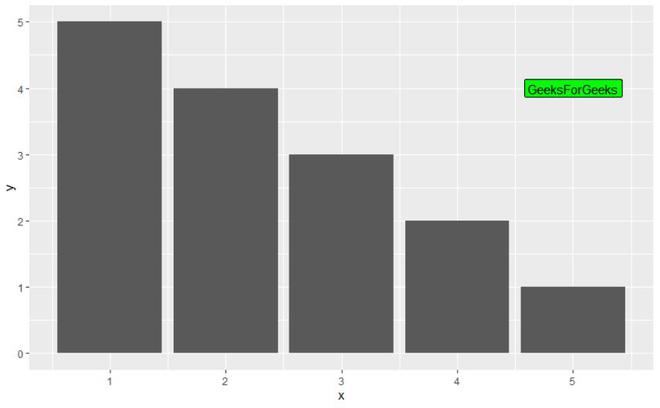
Example2:
R
library("ggplot2")
gfg_data<-data.frame(x=c(1,2,3,4,5),y=c(5,4,3,2,1))
gfg_plot<-ggplot(data=gfg_data, aes(x, y)) +
geom_bar(stat="identity")
gfg_plot + geom_label(aes(x = 5, y = 4,label = "GeeksForGeeks"),
fill = "green")
|
Output:
Share your thoughts in the comments
Please Login to comment...