How to Make a Side by Side Boxplot in R ?
Last Updated :
30 May, 2021
In this article, we are going to discuss how to create box plots side by side in the R programming language. If we want to create multiple box plots side by side then we have to specify a parameter in the above syntax i.e., beside=T. It will specify True. This will place the second, third,.,so on to next of the box plots
Syntax:
boxplot(data,beside=T)
Where,
- beside is to place bar plots side by side
- data is the combination of vector data which represents number of box plots needed to plot.
data=cbind(vector1,vector2,.,vector n)
Thus to implement this approach, first, the data to create each boxplot is initialized and then all of these are combined using cbind(). The combined data is then passed to the boxplot function along with beside parameter set to TRUE to draw them side by side.
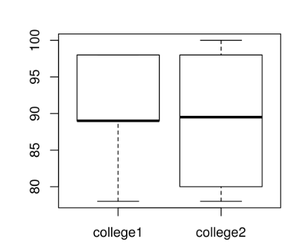
Example 1:
R
college1=c(98,89,89.0,78,98,89)
college2=c(88,91,100,78,98,80)
college_data=cbind(college1,college2)
boxplot(college_data,beside=T)
|
Output:
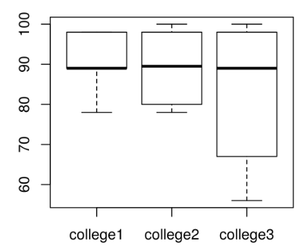
Example 2:
R
college1=c(98,89,89.0,78,98,89)
college2=c(88,91,100,78,98,80)
college3=c(98,89,89.0,100,67,56)
college_data=cbind(college1,college2,college3)
boxplot(college_data,beside=T)
|
Output:
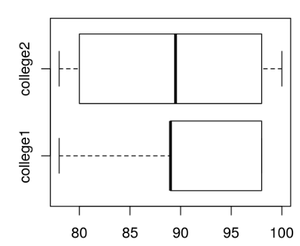
If we want to display the box plots side by side in a horizontal way, we can pass the parameter horizontal in the syntax.
Syntax:
boxplot(data,beside=T,horizontal=T)
Specifies the horizontal = True: arranges the plots in horizontal
If F- False, arranges in the vertical fashion
Example 3:
R
college1=c(98,89,89.0,78,98,89)
college2=c(88,91,100,78,98,80)
college_data=cbind(college1,college2)
boxplot(college_data,beside=T,horizontal=T)
|
Output:
Share your thoughts in the comments
Please Login to comment...