How to Make Boxplot with a Line Connecting Mean Values in R?
Last Updated :
31 Aug, 2021
Box plots are a good way to summarize the shape of a distribution, showing its median, its mean, skewness, possible outliers, its spread, etc. These plots are the best method for data exploration. The box plot is the five-number summary, which includes the minimum, first quartile, median, third quartile, and maximum.
In this article, we will discuss how to make a boxplot with a line connecting mean values in R programming language.
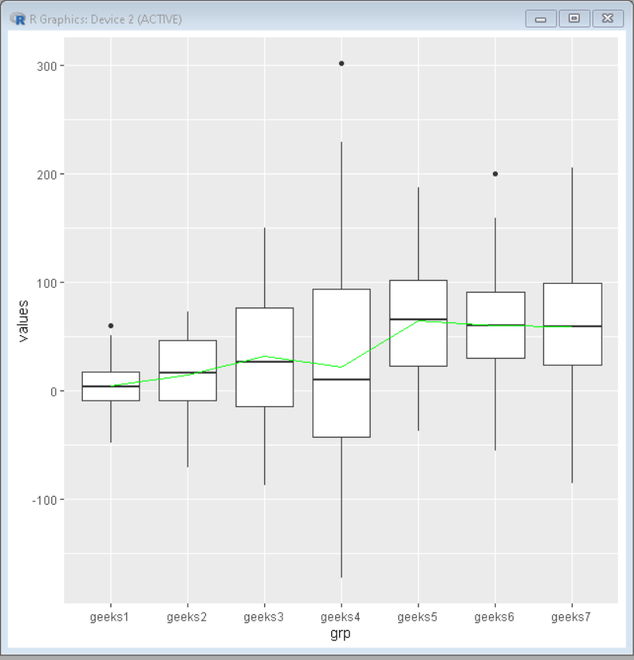
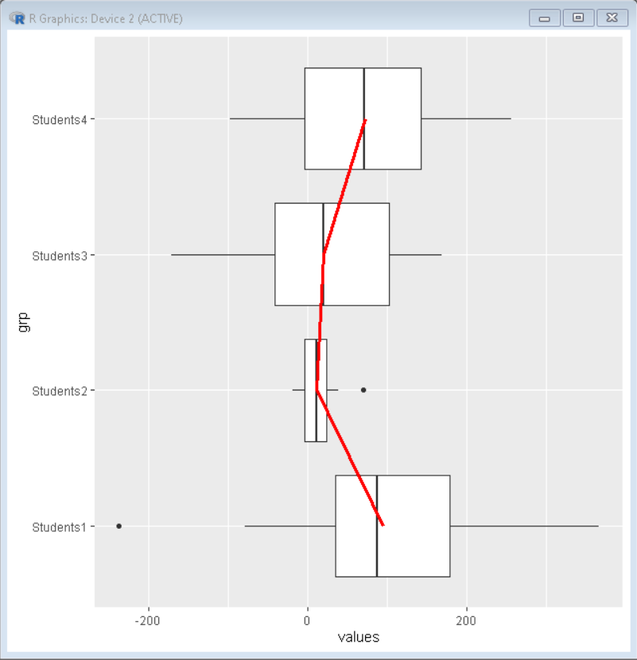
To create a boxplot with a line Connecting mean values in R we use the overlapping approach of ggplot2. We first create the simple ggplot2 boxplot. Then we take the mean values of data values from the data frame and store them in vector mean. Then by using the vector mean and geom_line() function of ggplot2 we overlap a line plot to a boxplot that replicates the effect of a line connection mean values.
Syntax:
ggplot() + geom_boxplot() + geom_line()
Example: R program to create a boxplot with line connecting mean values
R
library(tidyverse)
set.seed(1068)
df <- data.frame(grp = paste0("geeks",
rep(1:7, each = 56)),
values = c(rnorm(56, 7, 20),
rnorm(56, 14, 40),
rnorm(56, 28, 60),
rnorm(56, 56, 100),
rnorm(56, 63, 60),
rnorm(56, 63, 60),
rnorm(56, 63, 60)))
mean <- df %>%
group_by(grp) %>%
summarize(average = mean(values)) %>%
ungroup()
df %>%
ggplot(mapping = aes(x = grp, y = values)) +
geom_boxplot() +
geom_line(data = mean,
mapping = aes(x = grp, y = average, group=1),color="green")
|
Output:

Example: R program to create a boxplot with a line connecting mean values
R
library(tidyverse)
set.seed(1068)
df <- data.frame(grp = paste0("Students",
rep(1:4, each = 40)),
values = c(rnorm(40, 100, 122),
rnorm(40, 14, 21),
rnorm(40, 28, 93),
rnorm(40, 52, 100)))
mean <- df %>%
group_by(grp) %>%
summarize(average = mean(values)) %>%
ungroup()
df %>%
ggplot(mapping = aes(x = grp, y = values)) +
geom_boxplot() +
geom_line(data = mean,mapping = aes(x = grp, y = average, group=1),
color="red", size=1.4)+
coord_flip()
|
Output:

Like Article
Suggest improvement
Share your thoughts in the comments
Please Login to comment...