How to insert Charts in New Google Sites ?
Last Updated :
05 Nov, 2020

Sometimes, you want to add graphs and charts that you have created into your website to make your website more interactive, this can be done with the help of Google Sites. Google Sites allows the creator to embed charts make on Google Sheets into the website. To embed the charts into the website follow the steps mentioned below:
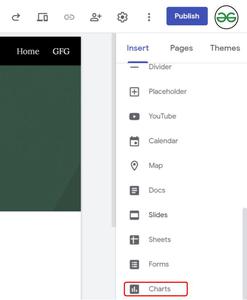
- Go to the Charts option in the insert panel present on the right side of the site page.
- Now select the sheet which has the chart in it to embed it.
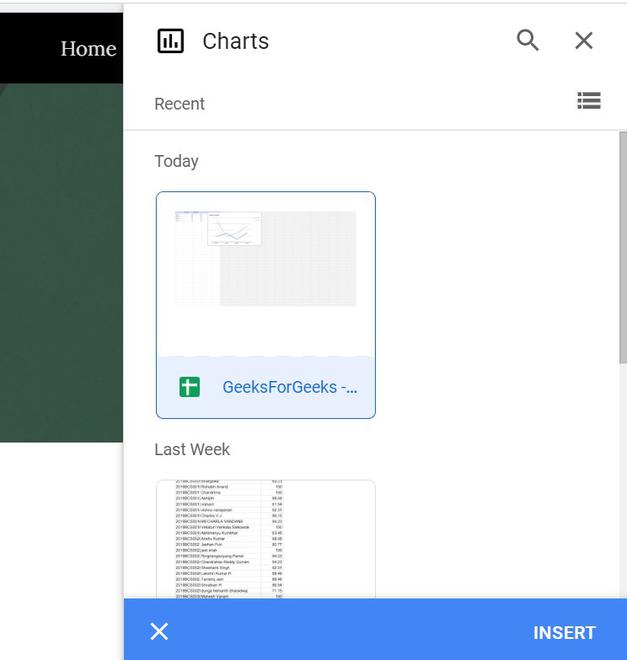
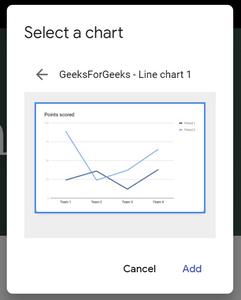
- After you select the sheet the Google Site will find the chart present in it and display the searched result so you can select the chart you want to embed in your site.
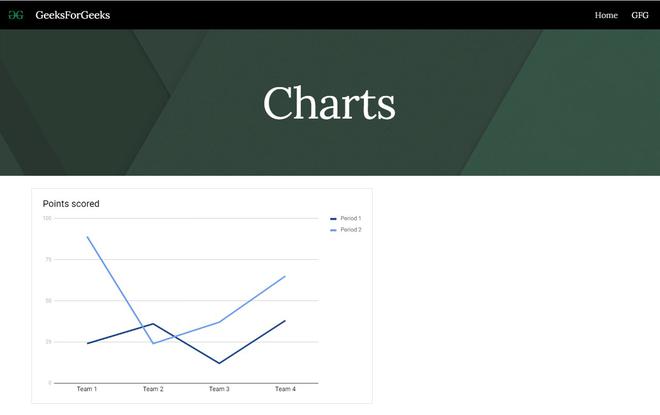
After this, your chart will be inserted into the page and will look like:
Note:
- The charts will be responsive, so on small screen you can click the chart to open it in full screen.
- Charts will update themselves when the sheet is updated.
Share your thoughts in the comments
Please Login to comment...