Combine two ggplot2 plots from different DataFrame in R
Last Updated :
30 May, 2021
In this article, we are going to learn how to Combine two ggplot2 plots from different DataFrame in R Programming Language. Here in this article we are using a scatter plot, but it can be applied to any other plot.
Let us first individually draw two ggplot2 Scatter Plots by different DataFrames then we will see how to combine them i.e how draw both plots in one plot field.
Plot 1:
R
library("ggplot2")
pointDF1 <- data.frame(XDF1 = rnorm(50),
YDF1 = rnorm(50))
ggplot(pointDF1, aes(XDF1, YDF1)) +
geom_point(fill = "dark green", color = "black",
size = 5, shape = 21)+
ggtitle("Plot-1")
|
Output:

First ggplot2 Plot
Plot 2:
R
library("ggplot2")
pointDF2 <- data.frame(XDF2 = rnorm(50),
YDF2 = rnorm(50))
ggplot(pointDF2, aes(XDF2, YDF2)) +
geom_point(fill = "green", color = "black",
size = 5, shape = 21)+
ggtitle("Plot-2")
|
Output:
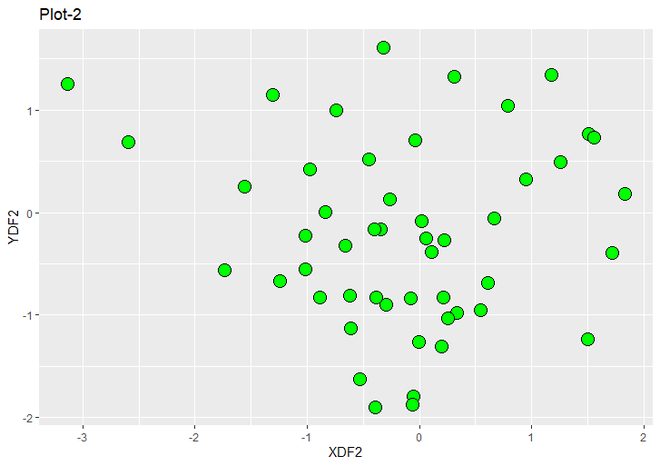
Second ggplot2 Plot
Now we are going to combine the above graphs into one graph. Everything works normally except for the plotting part. Combine the function to plot the two plots in one frame.
After combining the two plots, the question arises of what axis labels should be used. The answer is labs() function can be used to give custom labels. This step is completely optional.
Syntax:
labs(x = “X-Label”, y = “Y-label”)
Example:
R
library("ggplot2")
pointDF1 <- data.frame(XDF1 = rnorm(50),
YDF1 = rnorm(50))
pointDF2 <- data.frame(XDF2 = rnorm(50),
YDF2 = rnorm(50))
ggplot() +
geom_point(data = pointDF1, aes(XDF1,YDF1),
fill = "dark green", color = "black",
size = 5, shape = 21)+
geom_point(data = pointDF2, aes(XDF2,YDF2),
fill = "green", color = "black",
size = 5, shape = 21)+
labs(x = "X-Data", y = "Y-Data")+
ggtitle("Combined Plot")
|
Output:
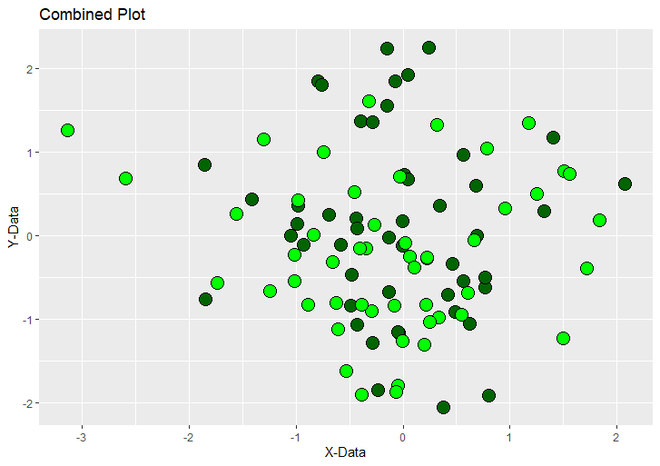
Combined Plot using ggplot2
Like Article
Suggest improvement
Share your thoughts in the comments
Please Login to comment...