The potential of machine learning (ML) goes beyond standalone applications. When you integrate your R code into a web application you unlock its power, for real-time predictions, interactive data exploration, and improved user experiences. In this article, we will guide you through the process of incorporating your R code into a website. We’ll cover concepts and essential steps. Provide concrete examples to ensure effective implementation.
All concepts related to the topic
- Frameworks like Shiny and Plumber facilitate communication between R Programming Language and web browsers. They enable you to create interfaces and deploy your ML models online.
- Serialization plays a role in converting R objects into a format that web browsers can easily understand. For this purpose, packages such as jsonlite and rjson can be used.
- The API endpoints are a bridge between your R code and your web application. Users can contact your model by sending requests and receiving responses using these endpoints.
- The user interface of your web application is critical to the development of front-end technologies such as HTML, CSS, and JavaScript.
Steps to create a shiny application in R
Step 1: First, we have to install R Studio and R 3.3.0 in our Windows operating system. You can install from below link:
https://posit.co/download/rstudio-desktop/
Step 2: You have options such as Shiny for building dashboards or Plumber for developing RESTful APIs. Each caters to different needs with its strengths.
Step 3: After the installation, In Rstudio, we will be creating our application in R script. To open the R script file:
Go to 'file' menu at the top -> new file -> R script
Step 4: In this application, we will creating a static website for getting a foundation knowledge of building the UI using Shiny app. Here is a code:
R
library(shiny)
library(shinythemes)
library(randomForest)
data(iris)
print(iris)
set.seed(123)
indices <- sample(1:nrow(iris), nrow(iris) * 0.7)
train_data <- iris[indices, ]
test_data <- iris[-indices, ]
rf_model <- randomForest(Species ~ ., data = train_data, ntree = 100)
ui <- fluidPage(theme = shinytheme("readable"),
titlePanel("Iris Species Prediction"),
sidebarLayout(
sidebarPanel(
numericInput("input_sepal_length", "Sepal Length:",
value = 5.0, min = 4.0, max = 7.0, step = 0.1),
numericInput("input_sepal_width", "Sepal Width:",
value = 3.0, min = 2.0, max = 4.5, step = 0.1),
numericInput("input_petal_length", "Petal Length:",
value = 1.5, min = 1.0, max = 6.0, step = 0.1),
numericInput("input_petal_width", "Petal Width:",
value = 0.5, min = 0.1, max = 2.5, step = 0.1),
actionButton("predict_button", "Predict Species")
),
mainPanel(
h4("Predicted Species:"),
verbatimTextOutput("predicted_species")
)
)
)
server <- function(input, output) {
output$predicted_species <- renderText({
new_data <- data.frame(
Sepal.Length = input$input_sepal_length,
Sepal.Width = input$input_sepal_width,
Petal.Length = input$input_petal_length,
Petal.Width = input$input_petal_width
)
predictions <- predict(rf_model, newdata = new_data)
paste("Predicted Species:", predictions)
})
}
shinyApp(ui = ui, server = server)
|
Output:
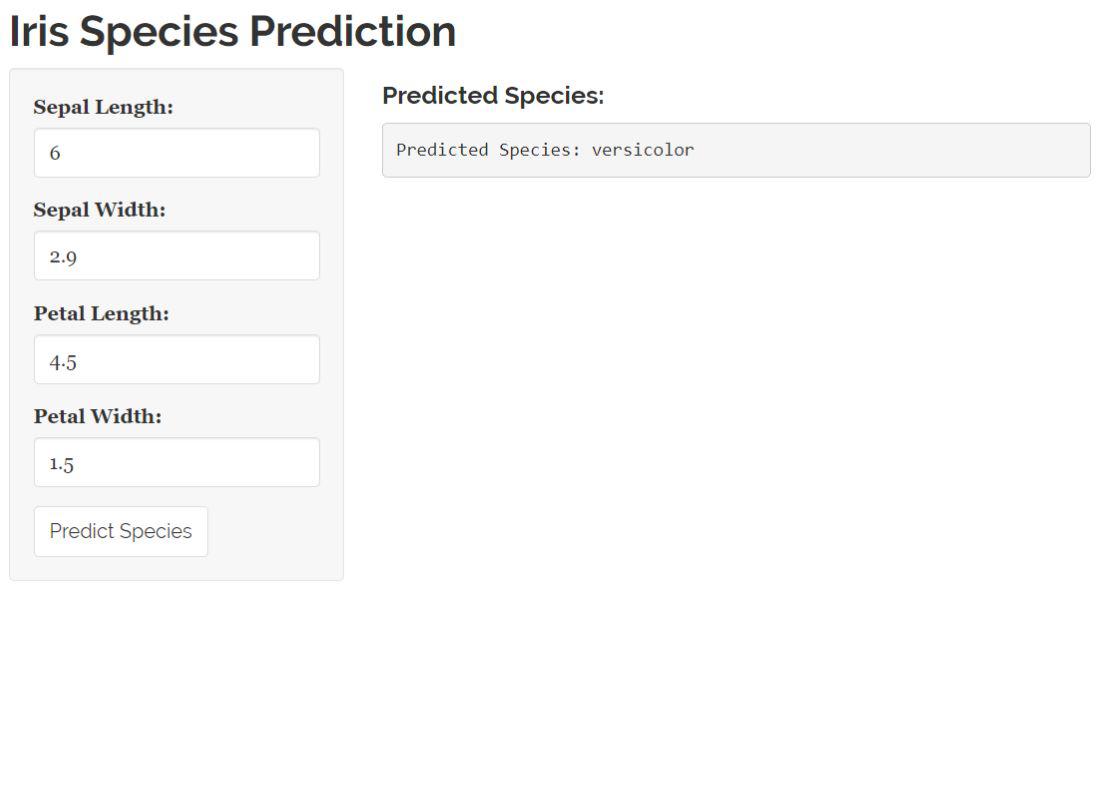
Machine-learning R code in a website
In this code, I have made a simple user-interation application, where you can your name and age on the inputs correspondingly it will displaying on the other textbox at the same time. Also Here, I have simple navbar which is functional i.e. you can switch between the tabs.
Here we will be break the code line by line for better understanding:
# Load R packages
library(shiny)
library(shinythemes)
library(randomForest)
The required R packages will be loaded in this part of the code. This is a core package for creating browser apps, and the second package that contains themes to customize your application’s appearance are shiny themes. For Prediction, We have to used some machine learning algorithm. In this code, I have used random forest classifier algorithm with the help of randomForest library to build random forest models.
# Load Iris dataset
data(iris)
# print Iris dataset
print(iris)
This code will load a built Iris dataset that comes with R. The data will be shown on the console for better understanding.
NOTE: With the help of the data printed in the console, You can test the prediction by changing their input values.
# Split the dataset into training and testing sets
set.seed(123)
indices <- sample(1:nrow(iris), nrow(iris) * 0.7)
train_data <- iris[indices, ]
test_data <- iris[-indices, ]
In order to create a training dataset, train_data and the remaining 30% for testing_data, this sets a baseline for reproducibility, then randomly samples 70% of the indices.
# Train the Random Forest model
rf_model <- randomForest(Species ~ ., data = train_data, ntree = 100)
In this code, There will be a randomForest function to train a random forest model (rf_model) on the training dataset (train_data). There are some target variables are Species, and ~ . means that all of the remaining variables in the data set are taken into account as a predictor. The number of trees in the forest is defined by ntree.
# Define UI
ui <- fluidPage(theme = shinytheme("readable"),
                titlePanel("Iris Species Prediction"),
                sidebarLayout(
                  sidebarPanel(
                    numericInput("input_sepal_length", "Sepal Length:", value = 5.0, min = 4.0, max = 7.0, step = 0.1),
                    numericInput("input_sepal_width", "Sepal Width:", value = 3.0, min = 2.0, max = 4.5, step = 0.1),
                    numericInput("input_petal_length", "Petal Length:", value = 1.5, min = 1.0, max = 6.0, step = 0.1),
                    numericInput("input_petal_width", "Petal Width:", value = 0.5, min = 0.1, max = 2.5, step = 0.1),
                    actionButton("predict_button", "Predict Species")
                  ),
                  mainPanel(
                    h4("Predicted Species:"),
                    verbatimTextOutput("predicted_species")
                  )
                )
)
This section defines the Shinyapp UI’s user interface. A fluid layout will be produced using the FluidPage function. The theme parameter lays out the Visual theme for the application “readable” in this instance. The input elements for sepal length, sepal width, blossom length and petals are included along with an action button that triggers the prediction. The layout in the application is organized into sidebar panel and a main panel.
NOTE: You can look into the link (https://rstudio.github.io/shinythemes/) which will used to exploring number of themes.
# Define server function
server <- function(input, output) {
  output$predicted_species <- renderText({
    # Create a data frame with user input
    new_data <- data.frame(
      Sepal.Length = input$input_sepal_length,
      Sepal.Width = input$input_sepal_width,
      Petal.Length = input$input_petal_length,
      Petal.Width = input$input_petal_width
    )

    # Make predictions using the trained Random Forest model
    predictions <- predict(rf_model, newdata = new_data)

    # Display the predicted species
    paste("Predicted Species:", predictions)
  })
}
The server function is defined in this way. The renderText function specifies how the output (predicted_species) should be displayed based on the user input. With the user input, it creates a new frame of data and uses an untrained forest model to forecast.
# Create Shiny app
shinyApp(ui = ui, server = server)
Finally, by combining the user interface and server components, shinyapp will be used to create Shiny applications. The UI definition is taken in the ui argument and server logic has been taken by the server argument. Creates and starts Shiny app with this function call.
Step 4: For seeing the actual output of the application:
- First we have to save our R script file in our local computer
- For running our application, you can simply click on ‘Run Shiny app’ or write the following command in the terminal which will automatically navigated to the application’s output.
runApp (path-of-saved-file)
Step 5 (Optional): Use the framework APIs to make connections between R code and user interface. For model predictions and data visualization, the API endpoints must be defined.
Step 6 (Deployment): Choose a suitable hosting provider such as Shinyapps.io or Heroku, so that your application can be accessed on the Internet.
Error in loadNamespace(i, c(lib.loc, .libPaths()), versionCheck = vI[[i]]) :
namespace ‘htmltools’ 0.5.6.1 is already loaded, but >= 0.5.7 is required
Then, you have to update the htmltools package with latest version. You can done this by running the following command in your R script or in R console and also restart the R session to see the effect:
R
install.packages("htmltools", dependencies = TRUE)
|
Advantages
- Your Multi Language Models and insights may be shared with a larger audience by using interactive web apps.
- It provides real-time feedback and the user’s personalised experiences on the basis of their input.
- It provides easier user-interaction with the data and see predictions in a dynamic manner.
- It is easier for your Models to be made readily available so that you can collaborate and share knowledge.
Disadvantages
- Deployment of the application is difficult.
- Prerequisite of various web frameworks are required to build any application.
- the server resources can be strained by running a large amount of R code in an Internet application, which may cause problems with performance.
- It may be more difficult to find errors when debugging a deployed Web application than it is for standalone R code, requiring additional tools and techniques.
There are tons of applications for building the application: interactive dashboards, model exploration, educational tools, personalized recommendations, dynamic content, Real-time processing, automated cleaning/pre-processing, interactive exploration.
At the end, there are a numerous of new possibilities when employing R code integrated on a Web page. If there are combination of web frameworks, strategies, serializations, and front-end technologies to generate machine learning models, they have the potential to be interactive and potent tools for a massive audience. Go code, let your imagination run wild, and you’re going to start showing the world your R power insights.
Share your thoughts in the comments
Please Login to comment...