How to Compile Reports from R Scripts to R Markdown
Last Updated :
11 Jul, 2023
A very power full feature of the R programming language is the package R markdown. This package provides us tools that are used to convert our data analysis into a well-formatted report in many formats so that, the stack holders will understand it easily. The formats of reports include HTML(default), PDF, MS Word, and MS PowerPoint. Efficient data reporting is essential for data analysts and scientists who need to communicate their findings effectively. R markdown allows for seamless integration of code, analysis, and text, resulting in dynamic and reproducible reports. R markdown offers flexibility in controlling how the output is displayed within the report.
R Markdown is a powerful tool that allows you to seamlessly combine code, text, and visualizations in a single document. R Markdown has a specific document structure, documents are organized into sections and subsections, which can be easily created using Markdown syntax. One of the main features of R Markdown is the ability to include code chunks. You can specify the programming language (like Python, Julia), set options, and event control. display of code and output. The results of the code execution, such as tables, plots, and computed values, are automatically included in the output document. R Markdown provides a wide range of customization options to improve the look, feel, and behavior of your document. You can choose different themes and templates to change the overall style, and modify code by incorporating CSS or LaTex code for fine control.
We can integrate R markdown with knitr, R Markdown is built on top of the knitr package, which provides the underlying engine for code execution and output generation. Since R Markdown documents are plain text files, they are highly compatible with version control systems like Git. This makes it easy to collaborate with others, track changes, and revert to previous versions if needed. R Markdown documents as a way to communicate your code and analysis to colleagues or stakeholders and subject matter experts.
Some real-world examples to further illustrate the power and versatility of computing reports from R script to R markdown,
To compile reports from R scripts to R markdown we had four steps,
- Set a working directory
- Test the script
- Install R markdown
- Run the render function
Set working directory
In R Programming Language, you can set the working directory using the ‘setwd()‘ function. The working directory is the default folder where R will look for files and where it will save files unless you specify.
Here is how you can set the working directory in R:
- Use the ‘setwd()‘ function followed by the path to the desired folder enclosed in quotes.
- For example, if we want to set our current working directory to Desktop.
R
setwd("C:\\Users\\rkkum\\OneDrive\\Desktop")
|
Additionally, you can check your current working directory using ‘getwd()‘ function.
Output
.png)
setting working directory
First, write an R script and save it. The script which you saved will be in your current working directory. Here is an example program to calculate the mean and median for given numbers.
R
numbers <- c(50, 73, 35, 86, 21, 66, 73,
17, 78, 90, 12, 30, 79)
mean_value <- mean(numbers)
median_value <- median(numbers)
print("Mean of numbers is")
print(mean_value)
print("Median of numbers is")
print(median_value)
|
Output:
[1] "Mean of numbers is"
[1] 54.61538
[1] "Median of numbers is"
[1] 66
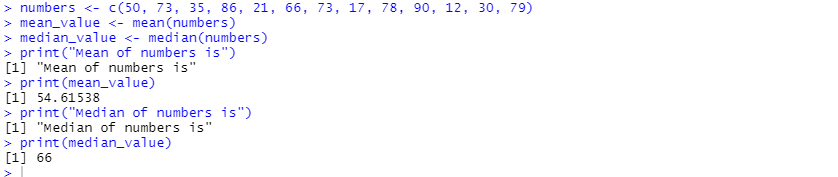
this is console output
In this script, we first create a vector called ‘numbers’ containing some random numbers. Then, we use the ‘mean()’ function to calculate the mean and the ‘median()’ function to calculate the median of the numbers in the ‘numbers’ vector and store result in the variable called ‘mean_value’, and ‘median_value’ respectively. After running the script result will be displayed without errors. I named the file with the “maths.r” name Remember this file name we use further in this article.
Install “rmarkdown” package
To install the “rmarkdown” package in R, we can use the ‘install.packages()’ function. “rmarkdown” package is used for creating dynamic documents and reports that mix r code with text, images, and other elements.
R
install.packages("rmarkdown")
library(rmarkdown)
|
Output:
installation of “rmarkdown” package
This code will download and install the “rmarkdown” package from the Comprehensive R Archive Network(CRAN). You can load the “rmarkdown” package using the ‘library()’ function. Now the installation message is displayed as shown above. Now you should be able to use the features and functions provided by the “rmarkdown” package.
Run ‘render()’ function
The ‘render()‘ function in R is used to render an R script into an output format such as HTML, PDF, or Word. It takes the R script as input and generates an output file of the desired format.
Earlier, we created an R script and named it as “maths.r”. Now, we render that file and generate an output document.
Syntax:
render(input_file, output_format, output_file)
where,
- input_file: Specifies the path or filename of the R markdown input file.
- output_format: Specifies the output format. It can be “html_document” for HTML, “pdf_document” for PDF, “word_document” for Word, “powerpoint_presentation” for ppt, or other supported formats.
- output_file: Specifies the filename of the output file that will be generated.
R
rmarkdown::render("maths.r",
output_format = "html_document")
|
Output:
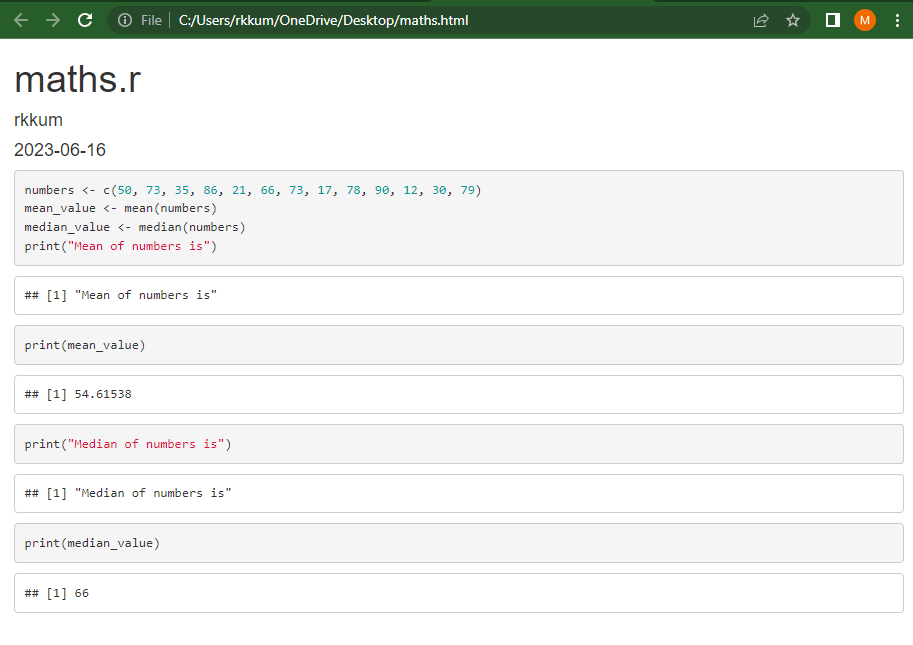
Report Compiled using R Markdown
The default output format of the render function is an HTML document. If we want to generate a Word document.
R
rmarkdown::render("maths.r", output_format = "word_document")
|
Output:
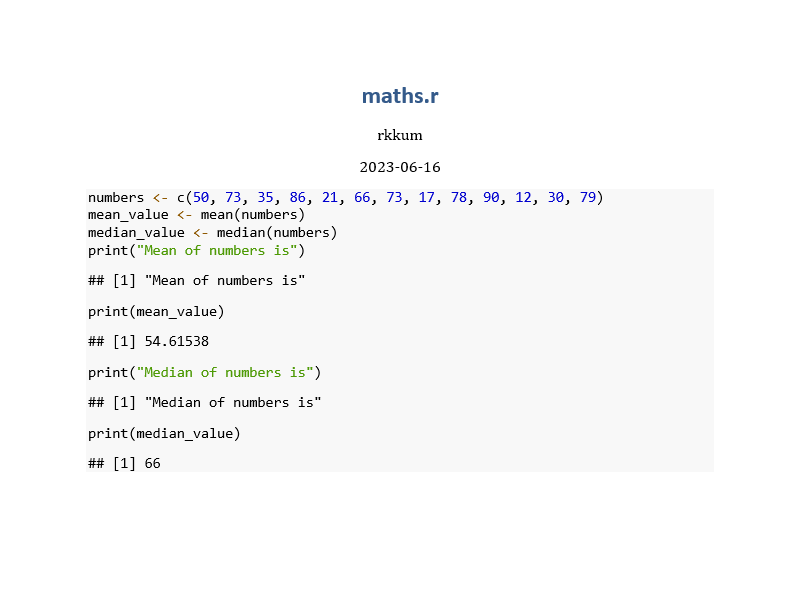
Report Compiled using R Markdown
These reports are mainly used fully when we work with visuals. For example, we create a scatter plot using the “ggplot2” and “palmerpenguins” packages.
R
install.packages("ggplot2")
install.packages("palmerpenguins")
library(ggplot2)
ggplot(data = penguins) + geom_point(mapping =
aes(x=bill_length_mm, y=bill_depth_mm, col = species))
|
Name the script as “visual.r”. This script will be saved in the current working directory and executed without error.
visuals are created by using the “ggplot2” package for that we have to install the “ggplot2” package and “palmerpenguins” package is used as a dataset. Coming to aesthetics on the x-axis “bill_length_mm” attribute is passed, and on the y-axis “bill_depth_mm” attribute is passed. And “geom_point()” is used to create a scatter plot. Now, render the script and generate the output file
R
install.packages("rmarkdown")
library(rmarkdown)
rmarkdown::render("visual.r",
output_format = "html_document")
|
Output:
As we know, the render function is used to compile reports from R scripts to R markdown, in the render() function we pass a file name that is “visual.r”, and output_format is set to “html_document”. If we want, we can change the output_format
Share your thoughts in the comments
Please Login to comment...