How to Create Horizontal Boxplots in R?
Last Updated :
19 Dec, 2021
In this article, we will discuss how to create horizontal boxplots in the R programming language.
Method 1: Create Horizontal boxplot in base R
In this method to create the horizontal bar plot, the user simply needs to call the boxplot() function which is a base function of the R language, then the user needs to call the horizontal argument of this function and initialize it with true value to get the box plot in a horizontal way.
boxplot() function: This function is used to produce box-and-whisker plot(s) of the given values.
Syntax: boxplot(formula, data = NULL, …, horizontal = TRUE)
Parameters:
- formula: a formula, such as y ~ grp, where y is a numeric vector of data values to be split into groups according to the grouping variable grp.
- data: a data.frame (or list) from which the variables in the formula should be taken.
- horizontal: logical indicating if the boxplots should be horizontal.
- … : Other parameters
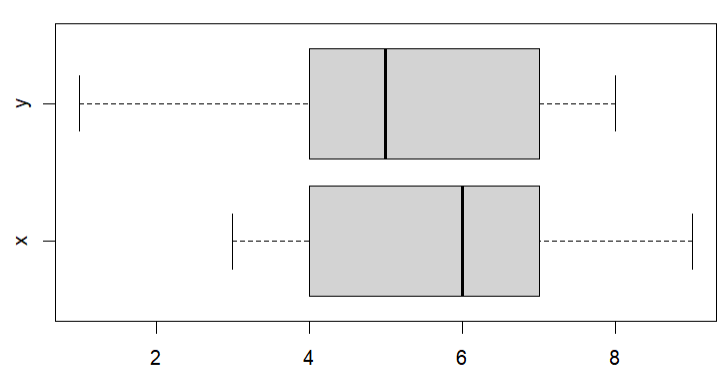
Example: In this example, we are taking a data frame with 2 variables to create the horizontal boxplot of the given variable using the boxplot with a horizontal argument with it in the R programming language.
R
gfg<-data.frame(x=c(6,8,9,6,4,7,6,3,4),
y=c(4,6,8,7,8,4,5,1,3))
boxplot(gfg,horizontal=TRUE)
|
Output:
Method 2: Create a Horizontal boxplot using coord_flip()
In this method to create the horizontal boxplot in ggplot2, the user needs to install and import the ggplot2 package in the working R console, here the ggplot2 package is responsible to plot the boxplot and provide other functionalities of the package. Then the user needs to simply call the geom_boxplot() function which will be simply plotting the boxplot in the vertical way of the given data and with it the user also needs to call the coord_flip() which will be flipping the axis and the final boxplot will be resulting in the horizontal boxplot in the R programming language.
Syntax to import and install ggplot2 package in R language:
install.package("ggplot2")
library("ggplot2")
coord_flip() function: This function is used to flip cartesian coordinates so that horizontal becomes vertical, and vertical, horizontal.
Syntax: coord_flip(…)
Parameters:
- …: Other arguments passed
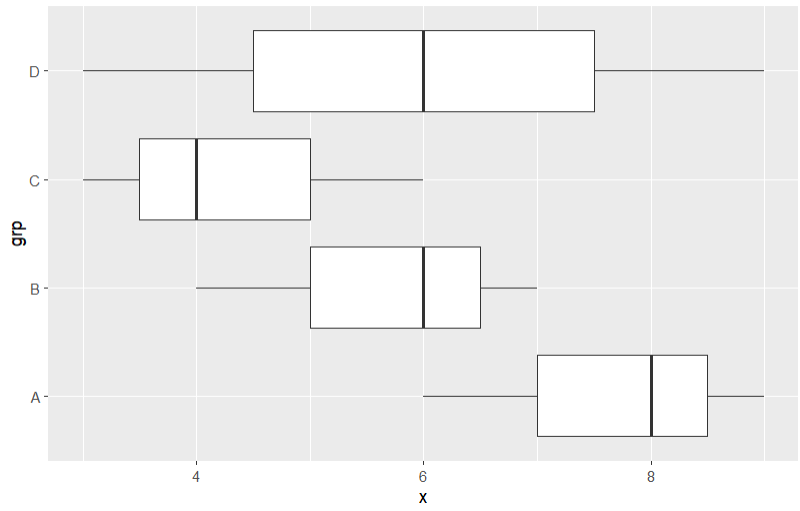
Example: In this example, we will be using the geom_boxplot() function with the coord_flip() function from the ggplot2 package to plot the horizontal boxplot of the given data in the R programming language.
R
library(ggplot2)
gfg<-data.frame(x=c(6,8,9,6,4,7,6,3,4,9,6,3),
grp=rep(c('A','B','C','D'),
each=3))
ggplot(gfg,aes(x=grp,y=x)) +geom_boxplot() + coord_flip()
|
Output:
Share your thoughts in the comments
Please Login to comment...