How to Adjust Marker Size in Matplotlib?
Last Updated :
19 Dec, 2021
In this article, we are going to see how to adjust marker size in Matplotlib in Python.
We can adjust marker size in plots of matplotlib either by specifying the size of the marker in either plot method or scatter method while plotting the graph.
Method 1: Using Plot
plot() method used to plot the graph between 2 data points. It takes 4 parameters those are 2 data points, marker, and marker-size.
Syntax: matplotlib.pyplot.plot(data1, data2, marker=’.’, markersize=constant)
Parameters:
- data1,data2- Variables that hold data.
- marker=’.’ – Indicates dot symbol to mark the datapoints.
- markersize- Represents size of marker
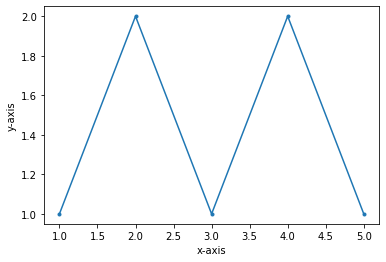
Example 1: Plot a graph using the plot method with standard marker size. (We do not need to mention the marker size in plot method)
Here we just plotted the graph using plot method with standard marker size.
Python3
import matplotlib.pyplot as plt
data1 = [1, 2, 3, 4, 5]
data2 = [1, 2, 1, 2, 1]
plt.plot(data1, data2, marker=".")
plt.xlabel('x-axis')
plt.ylabel('y-axis')
|
Output:
Example 2: To adjust the size of marker in a plot use markersize parameter to plot method to adjust the marker size.
Here in this example, we adjusted the marker size to size 20 such that the maker size is increased from its standard size.
Python3
import matplotlib.pyplot as plt
data1 = [1, 2, 3, 4, 5]
data2 = [1, 2, 1, 2, 1]
plt.plot(data1, data2, marker=".", markersize=20)
plt.xlabel('x-axis')
plt.ylabel('y-axis')
|
Output:

Method 2: Using scatter()
scatter is a method present in matplotlib library which is used to set individual point sizes. It takes 3 parameters 2 data points and a list of marker point sizes.
Python3
import matplotlib.pyplot as plt
data1 = [1, 2, 3, 4, 5]
data2 = [0, 0, 0, 0, 0]
sizes = [10, 20, 30, 40, 50]
plt.scatter(data1, data2, sizes)
plt.xlabel('x-axis')
plt.ylabel('y-axis')
|
Output:
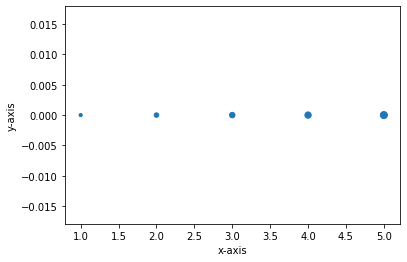
There is flexibility in scatter that is we can specify the size for each point so that it can be easily distinguished.
Share your thoughts in the comments
Please Login to comment...