Power BI – Distinct() function
Last Updated :
16 Jan, 2023
Data Analysis Expressions (DAX) include many functions that return a table rather than a value. The table isn’t displayed but is used to provide input to other functions. For example, you can retrieve a table and then count the distinct values in it or calculate dynamic sums across filtered tables or columns.
Dataset used:
The given data set contains information on the library supplies sold by a library manufacturer to different clients. All the relevant details like client name, client state name, product unit, etc. can be seen in it.
Dataset Link: SLS Order Details_Client Master
Distinct () function in Power BI
It is a Table Manipulation function that returns a table or manipulates existing tables. Measures are used in some of the most common data analyses.
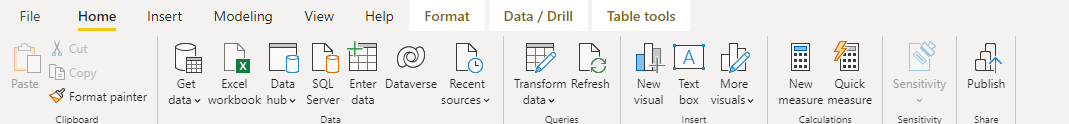
New Measure
Go to New measures, and switch to Table tools from there.
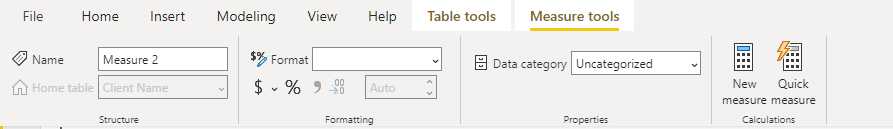
Measure tools
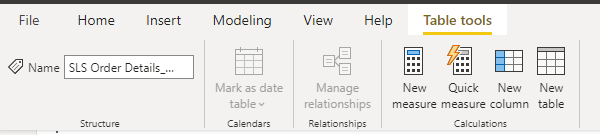
Table tools
Example 1:
The DAX DISTINCT returns a one-column table that contains the distinct values from the specified column. In other words, duplicate values are removed, and only unique values are returned.
Syntax: DISTINCT (<column name>)
Output:
Below the table created to which the distinct query needs to be applied, it is the one-column table that contains the distinct values from the specified column or table expression.

Earlier Table
Example 1:
The distinct query for the alphabet datatype.
Formula: DISTINCT('SLS Order Details_Client Master'[Client Name])
Output:
Example 2:
The distinct query for the number data type column.
Formula: DISTINCT('SLS Order Detials_Master'[Product Unit])
Output:
Example 3:
The distinct query for the date datatype column.
Formula: DISTINCT('SLS Order Detials_Master'[Order Date (dd-mm-yyyy)])
Output:
Share your thoughts in the comments
Please Login to comment...