Create a plot with Multiple Glyphs using Python Bokeh
Last Updated :
08 Dec, 2021
In this article, we will be learning about multiple glyphs and also about adding a legend in bokeh. Now bokeh provides us with a variety of glyphs that can be used to represent a point in a plot. Some glyphs are circle, square, asterik, inverted_triangle(), triangle() etc.
Installation
This module does not come in-built with Python. To install it type the below command in the terminal.
pip install bokeh
Multiple Glyphs in Bokeh
In this example, we will be exploring different types of glyphs in bokeh. Every glyph in the below implementation has different properties to identify themselves. So, lets us move to the code to understand the concept.
Code:
Python3
import numpy as np
from bokeh.plotting import figure, show
x = np.arange(5)
y = x**2
z = x*3
p = np.linspace(1,20,7)
q = np.linspace(1, 10, 7)
r = np.linspace(1, 30, 5)
a = np.arange(31)
fig = figure(plot_width = 600 , plot_height = 600)
fig.circle(x, y, color = "red", size = 20)
fig.square(x, z, color = "blue", size = 15, alpha = 0.5)
fig.hex(y, z, color = "green", size = 10, alpha = 0.7)
fig.line(x, y, color = "green", line_width = 4)
fig.inverted_triangle(p, q, color = "yellow", size = 20, alpha = 0.4)
fig.diamond(x, r, color = "purple", size = 16, alpha = 0.8)
fig.cross(a, a, size = 14)
show(fig)
|
Output:
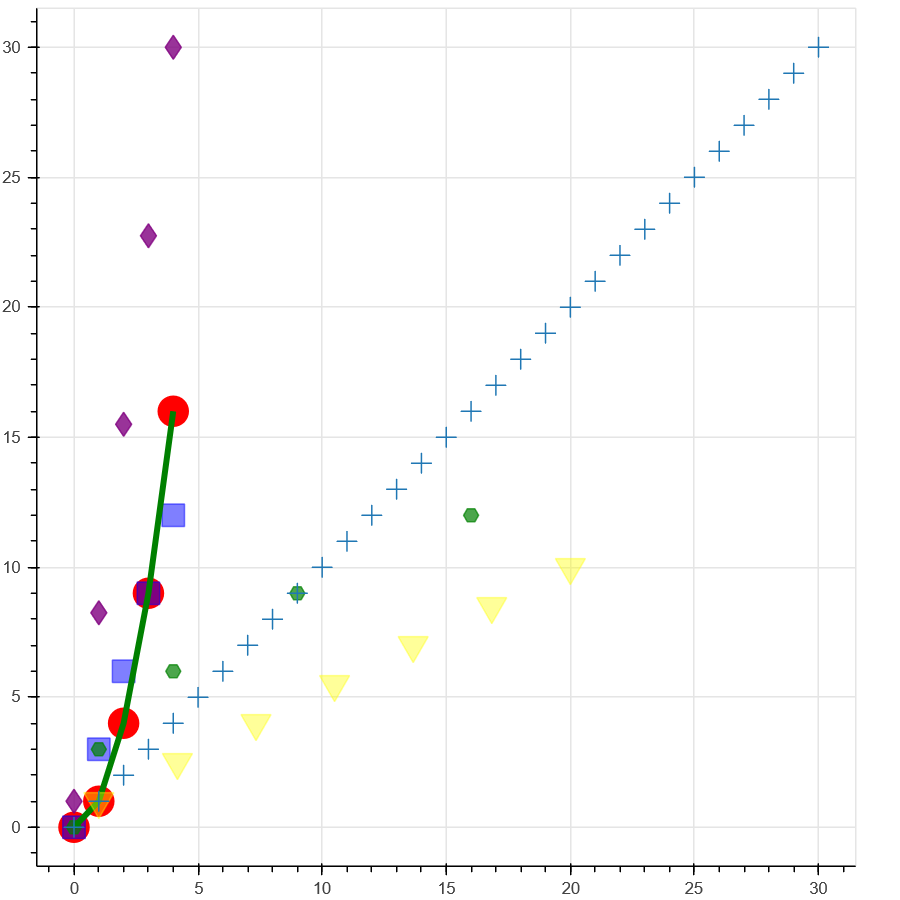
Explanation:
- At first, we are importing numpy, figure, and show packages from different modules.
- Now, we are creating a range of numbers using arrange and storing the list in x.
- Thereafter, we are also initializing different variables in order to plot the graph against each other.
- After initialization, we are creating an empty figure with plot width and height as 600.
- Since bokeh provides us with different types of glyphs, we are implementing some of them in this example with various colors and sizes of the points. The set of points with shape as circle has a color red and size as 20 whereas the set of points with shape as a hex has green color along with a size of 10 and the opacity of the color is 0.7(denoted by alpha).
Multiple glyphs with bokeh legend
Now, lets us move to the next topic of this article and that is bokeh legend. Legend plays a very important role in bokeh plots. They help us to identify different types of glyphs that are used in a plot. Along with that, we can also change different properties of the box that can differentiate different glyphs.
Example 1:
In this example, we will be exploring multiple glyphs along with bokeh legend to identify them and also changing some properties of the box differentiating the plots. This is important because, in a plot with various types of glyphs, we need something to identify them and that is when bokeh legend plays its role. Lets us move to the code implementation now.
Code:
Python3
import numpy as np
from bokeh.plotting import figure, show
x = np.arange(11)
y = np.linspace(1,5,11)
z = np.linspace(0,2,11)
p = figure(plot_height = 600 , plot_width = 600)
p.circle(x, y, legend_label = "Circle", size = 30)
p.square(x, y*2, legend_label = "Square", size = 20, color = "green")
p.inverted_triangle(x, y*3, legend_label = "Inverted Triangle",
size = 15, color = "purple")
p.legend.glyph_height = 50
p.legend.glyph_width = 90
show(p)
|
Output:
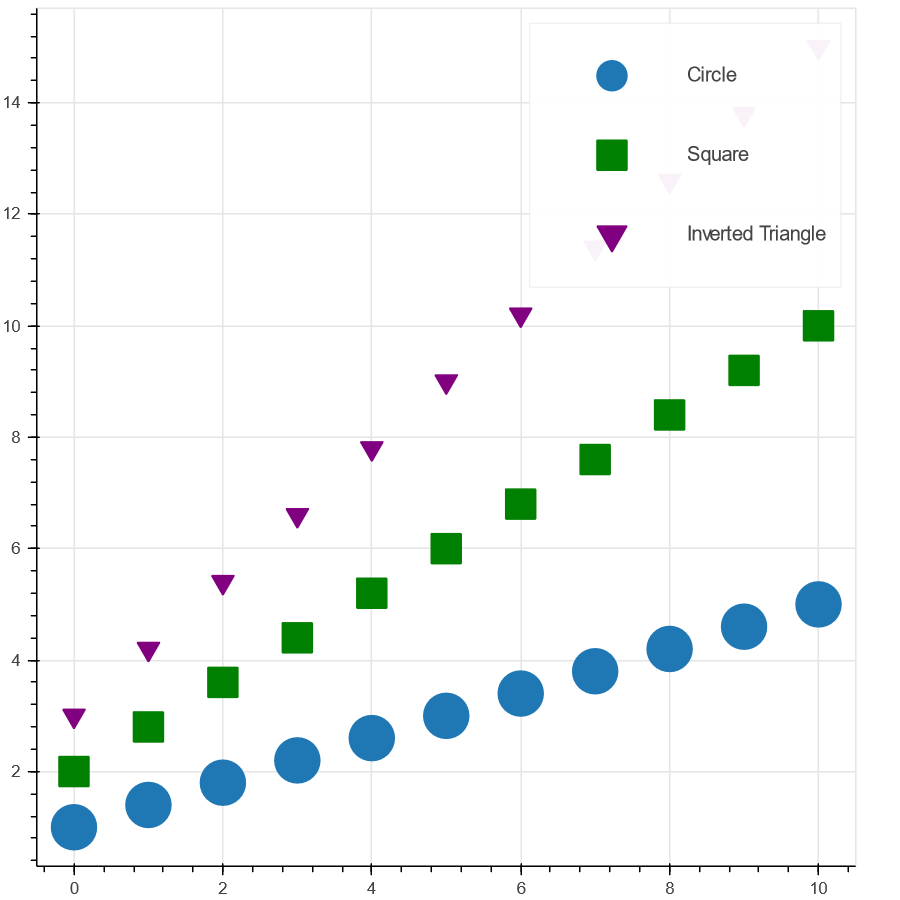
Explanation:
- We are creating three different variables with a set of values that are plotted against each other.
- We can see three plots, each of different glyphs. According to the code we have provided circular glyphs with size 30, square glyphs with size 20, and inverted triangle glyphs with size 15. Also, all the glyphs are of different colors too.
The main concept that lies in this example is, we have provided labels for each of the plots in the graph, and using legend in bokeh, we are changing the properties of the glyphs shown in the box in the top right corner(which is by default).
Example 2:
In the last example, we will be importing a dataset to our code. After that we will be plotting different graphs and using bokeh legend, we will be changing the label size and glyph size respectively. Let us move to the implementation.
Code:
Python3
from bokeh.sampledata.autompg import autompg
from bokeh.models import ColumnDataSource
from bokeh.plotting import figure, show
source = ColumnDataSource(autompg)
p = figure(plot_height = 600, plot_width = 600)
p.circle(x = 'hp', y = 'mpg', size = 20,
alpha = 0.6, source = autompg ,
legend_label = "Blue")
p.circle(x = 'hp', y = 'displ', size = 20,
alpha = 0.6, color = "green" , source = autompg,
legend_label = "Green")
p.legend.label_height = 50
p.legend.label_width = 50
p.legend.glyph_width = 90
p.legend.glyph_height = 90
show(p)
|
Output:
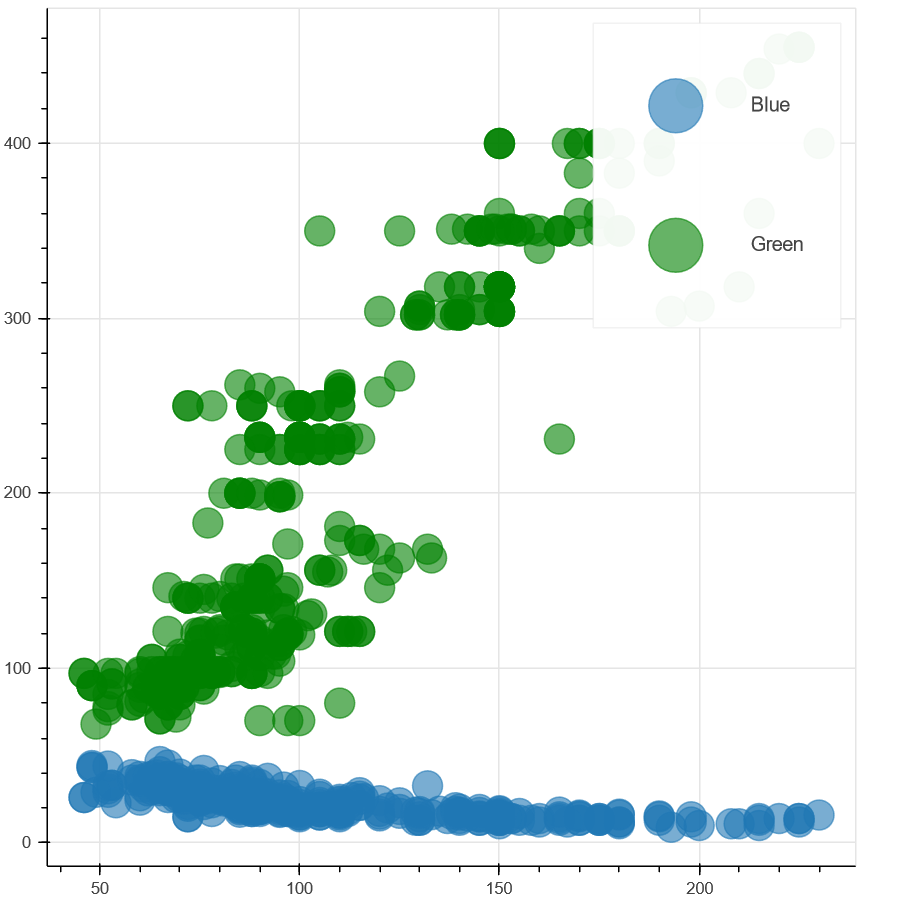
Explanation:
- Along with importing all the packages which we have imported earlier, this time we are importing a new dataset auto-mpg. Along with that, we are also importing the ColumnDataSource package.
- With ColumnDataSouce package we are creating it manually which helps us to share data between multiple plots and widgets.
- After that, we are plotting data taken from auto-mpg data-set against each other.
- Then using legend property of bokeh (figure.legend.label_width,figure.legend.glyph_width,figure.legend.label_height,figure.legend.glyph_height) we are changing the size of the labels and glyphs used to identify plots in the graph.
Share your thoughts in the comments
Please Login to comment...